

AI trade analysis applies multimodal models, chart-parsing algorithms, and signal-generation layers to produce structured trade plans from raw price data or chart images. The practical verdict: treat these outputs as a repeatable pre-trade checkpoint and research accelerator, not an autonomous decision system. Firms like Optiver and institutions such as QuantInsti have documented both the genuine utility and the hard limits of these systems. Platforms like SafeFly extend that utility into live execution by enforcing risk controls that AI analysis alone cannot provide.
Common immediate outputs from AI trade analysis tools include:
- Entry zone: a price level or range where the model identifies favorable risk/reward
- Invalidation/stop level: the price at which the setup is no longer valid
- Profit targets: one or more exit levels, often tiered (T1, T2, T3)
- Setup grade or confidence score: a letter grade or percentage reflecting pattern clarity and historical reliability
- Bear case summary: a structured list of conditions that would negate the trade thesis
Key Takeaways
AI trade analysis is most reliable when used as a structured pre-trade checkpoint with explicit invalidation levels, adversarial testing, and broker-side execution controls in place.
| Point | Details |
|---|---|
| AI as a checkpoint, not an autopilot | Use AI outputs to validate setups, not to generate trades without human review at each step. |
| Invalidation levels are non-negotiable | Require an explicit stop level from every AI tool; commentary without a stop price is not a trade plan. |
| Backtest and adversarial-test before scaling | Walk-forward validation and adversarial prompting reduce the risk of overfitting and automation-trap errors. |
| Execution controls are a separate layer | Broker-side protective stops, daily P&L lockouts, and multi-account mirroring are not provided by AI analysis tools. |
| SafeFly for multi-account futures execution | SafeFly mirrors trades across Tradovate accounts with broker-side stops and OAuth integration, enforcing the risk controls AI analysis alone cannot. |
Table of Contents
- What AI chart analysis tools actually deliver
- How the models work and where they break down
- A concrete workflow from idea to executed trade
- Where AI adds real value and where it fails predictably
- How to evaluate an AI trade analysis tool before committing capital
- ChartAnalyst, Trade AI, and TrendSpider: what each one is best for
- Evidence-based safeguards before trusting AI outputs with capital
- Moving from AI signals to live execution
- Can ChatGPT analyze charts and produce trade plans?
- A practitioner's view on integrating AI into a disciplined trading process
- SafeFly gives multi-account futures traders execution controls AI analysis cannot
- Sources
What AI chart analysis tools actually deliver
The standard output set across most AI trading analytics platforms is more consistent than vendor marketing suggests. Pattern detection, entry zones, stop levels, multi-target exits, risk/reward ratios, and setup grades are the core deliverables. Purpose-built screenshot tools return all of these from a single chart image upload, producing a structured trade review that functions as a repeatable pre-trade checklist.
Input methods vary by platform:
- Screenshot or image upload: the trader captures a chart and submits it directly
- Ticker lookup: the platform pulls live or delayed data and runs its own analysis
- Chat or LLM prompt: the trader describes a setup or pastes indicator readings and receives a narrative response
- API or streaming data feed: for automated or semi-automated workflows requiring real-time signal generation
Workflow elements worth confirming before committing to any platform include scanning across symbol lists, backtest or backfill capability, alert delivery (email, webhook, push), report export, and grade history logging. Grade history is particularly useful: it lets traders audit whether the tool's confidence scores have correlated with actual outcomes over time.
Pro Tip: Look for tools that produce the same structured output from the same input every time. Repeatability is the minimum bar for a tool that will influence real capital decisions. If two identical chart screenshots produce inconsistent grades, the tool's signal is unreliable.
How the models work and where they break down
Most AI trade analysis platforms combine two layers. The first is a vision or chart-parsing layer: optical character recognition reads price labels, candle detection identifies bar structure, and indicator synthesis extracts values from overlaid studies. The second is a machine learning layer that classifies patterns, estimates probabilities, and generates the structured output.
Model types in use across the industry include:
- Supervised pattern classifiers: trained on labeled historical chart patterns (head and shoulders, bull flag, etc.) to identify recurrences
- Temporal models (LSTM and transformer architectures): designed to capture sequential price dependencies and regime context
- Reinforcement learning for execution: reward-focused models trained to optimize order timing and sizing, used primarily in institutional settings
Data inputs feeding these models typically include price history, volume, session context (time of day, day of week), news or sentiment feeds, and synthetic data generated to expand training sets in low-frequency pattern categories.
The limitations are well-documented. QuantInsti's practitioner guide identifies overfitting, LLM hallucinations, and data quality problems as the primary failure modes across the AI trading lifecycle, from feature extraction through execution. Look-ahead bias in backtests is a persistent issue: models trained on data that includes future information produce results that cannot be replicated in live trading.
The most consequential limitation for active traders is the gap between rule-based task performance and multi-step reasoning. Optiver's applied AI research found that LLMs handle rule-based calculations reliably but commonly fail to update their views after sequential signals and underperform on consistent expected-value (EV) maximization. A model that produces a clean entry signal may still fail to reason correctly about whether that entry is positive EV after accounting for spread, slippage, and the probability of adverse selection.
A concrete workflow from idea to executed trade
Translating AI outputs into disciplined trades requires a structured process. The following sequence applies across markets and tool types.
- Scan for setups. Use the platform's screener or your own watchlist to identify candidates meeting basic criteria: trend alignment, volume confirmation, proximity to a key level.
- Run AI analysis. Submit the chart screenshot, ticker, or prompt to the tool. Collect the full structured output: grade, entry zone, stop, targets, risk/reward, and bear case.
- Convert outputs to a checklist. Extract four items from the AI read: pattern clarity (is the structure unambiguous?), volume confirmation (does volume support the move?), broader market context (does the setup align with sector or index direction?), and the invalidation level (is the stop placement logical and executable?).
- Backtest or spot-check. Locate two to five historical instances of the same pattern on the same instrument. Confirm the AI's grade would have been consistent and that the stop placement would have been survivable.
- Size and route the order. Apply a fixed fractional or volatility-adjusted sizing rule. Confirm the order type (limit vs. market) and verify that a protective stop is in place at the broker level before entry.
- Post-trade review. Log the AI grade, the actual outcome, and any deviation between the model's stop/target and what the market delivered. This log becomes the audit trail for evaluating the tool over time.
Pro Tip: Before entering any trade flagged by an AI tool, ask the model explicitly: "List the three most likely ways this trade fails." This adversarial prompt forces the system to surface liquidity risks, false breakout scenarios, and macro context it may have deprioritized in the initial analysis. It also reveals whether the tool's reasoning is coherent or superficial.
A practical sizing example: if the AI identifies a stop below entry and the trader's rule is to risk a small fraction of account equity per trade, the position size is the risk fraction divided by the stop distance. The AI provides the invalidation level; the trader applies the risk rule. These two functions should never be merged.
Where AI adds real value and where it fails predictably
AI trading analytics tools deliver genuine advantages in specific, well-defined areas. Speed and scale are the clearest: a platform can scan thousands of symbols in the time it would take a trader to review a single chart manually. Consistency is the second advantage. The model applies the same criteria to every chart, eliminating the fatigue and recency bias that affect human pattern recognition after extended screen time. Objective grading across markets is a third: the same framework applies to equities, forex, crypto, and futures without the trader's implicit preference for familiar instruments.
The failure modes are equally predictable:
- The automation trap: traders over-trust a well-articulated AI explanation and skip their own validation steps. A persuasive narrative is not evidence of a high-probability setup.
- EV estimation weaknesses: as Optiver's research documents, models often default to conservative heuristics rather than committing to positive-EV choices consistently. The gap between theoretical signal quality and realized performance is real.
- Regime shifts: models trained on trending markets underperform in mean-reverting regimes and vice versa. No model self-reports its regime sensitivity reliably.
- Thin liquidity and execution risk: AI signals generated on daily charts may assume fill prices that are not achievable in thinly traded instruments or at the open.
Pro Tip: Combine AI signals with explicit limit-order rules. If the model's entry zone is a range, define the exact price at which you will place a limit order and the maximum slippage you will accept before canceling. Never assume the fill matches the model's assumed entry.
How to evaluate an AI trade analysis tool before committing capital
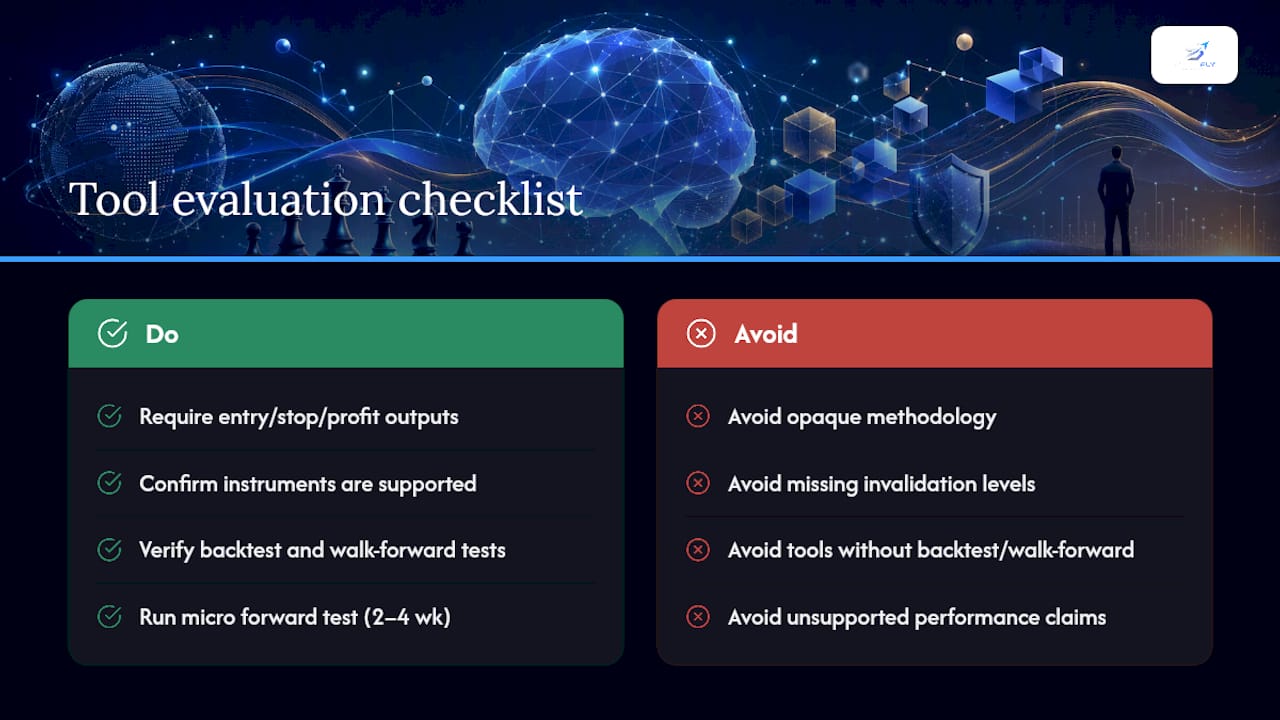
The evaluation checklist that matters for live trading differs from the feature list vendors highlight. Work through these dimensions systematically.
Outputs delivered: Does the tool produce entry, stop, and profit targets, or only narrative commentary? Commentary-only tools require the trader to derive all actionable levels independently, which defeats the purpose of structured AI analysis.
Markets supported: Confirm coverage of the specific instruments in the trader's universe. Stocks, forex, crypto, and futures each have structural differences (session hours, contract specs, liquidity profiles) that affect signal quality.
Input methods: Screenshot upload, ticker lookup, and API access serve different workflow needs. A mobile-first trader needs capture and chat; a systematic trader needs API or webhook delivery.
Backtesting and walk-forward capability: A tool without backtesting cannot demonstrate that its signals have historical validity. Walk-forward testing, which tests the model on data it has never seen, is the minimum standard for avoiding look-ahead bias.
Broker and execution integrations: Webhook alerts, REST APIs, and direct broker SDK connections determine whether signals can be acted on quickly. Confirm whether the tool supports the trader's specific broker or platform.
Audit trail: Grade history logging allows traders to correlate AI confidence scores with actual outcomes. Without it, there is no basis for evaluating the tool's reliability over time.
Pricing and trial availability: A free tier or time-limited trial is the standard for credible tools. Vendors unwilling to offer a trial period warrant additional scrutiny.
Red flags to watch for: opaque methodology with no explanation of how grades are calculated, missing invalidation levels in the output, no backtest or walk-forward capability, and vendor performance claims unsupported by a documented test methodology. TrendSpider's BBB profile is an example of the kind of public business record that supports basic vendor due diligence.
Test steps before committing capital: submit a known historical trade to the tool and verify that the output matches what a skilled trader would have identified. Submit the same chart twice and confirm the output is consistent. Run a small forward test with micro-size positions for two to four weeks before scaling.
ChartAnalyst, Trade AI, and TrendSpider: what each one is best for
These three tools represent distinct approaches to AI trade analysis, and the differences in their design reflect genuine differences in trader workflow.
ChartAnalyst operates on a screenshot-to-trade-plan model. A trader uploads a chart image and receives a structured review: setup grade, pattern identification, entry zone, stop level, and profit targets. The output is designed to function as a pre-trade checklist rather than a research platform. It suits traders who want a fast, repeatable second opinion on a setup they have already identified, without building a full research workflow around the tool.
Trade AI (Chart AI Analysis app) takes a mobile-first approach with three input modes: capture (screenshot), chat assistant, and ticker lookup. The platform covers crypto, forex, and stocks and offers a free tier with limited analyses alongside premium plans for unlimited usage. The chat mode allows traders to ask follow-up questions about a setup, making it useful for traders who want an interactive analysis experience rather than a static report. The ticker lookup mode is particularly practical for traders monitoring a watchlist on the go.
TrendSpider is a broader research platform. Its AI assistant, Sidekick, automates scanning, pattern detection, and setup surfacing, while the platform's integrated backtesting tools allow traders to test strategies against historical data without leaving the environment. TrendSpider positions its AI as a tool that handles the repetitive analytical work so traders can focus on decision-making, rather than promising precise signals. It suits traders who want an integrated research and backtesting environment rather than a standalone signal generator.
For traders evaluating AI-driven trading workflows across platforms, TradeAiFi's leaderboard provides a useful reference point for comparing performance transparency across AI trading platforms.
Evidence-based safeguards before trusting AI outputs with capital
The research consensus from Optiver and QuantInsti converges on a single principle: use AI as an adversarial assistant that challenges trading hypotheses, not one that confirms them. The TradingAgents multi-agent framework formalizes this approach by modeling a research desk as multiple agents, including a bull analyst, a bear analyst, and a risk team, that debate a position before producing a structured decision trail. The output is a reviewable audit record, not a live execution signal.
Practical safeguards to implement before scaling any AI-assisted strategy:
- Adversarial prompting: explicitly ask the model to list failure modes, liquidity risks, and adverse selection scenarios for every setup it grades positively
- Backtest with look-ahead bias controls: confirm that the model's training data does not include any information unavailable at the time of the historical signal
- Walk-forward validation: test the model on out-of-sample data across at least two distinct market regimes (trending and range-bound)
- Parameter sensitivity checks: vary the model's key inputs slightly and confirm that outputs remain stable. A model whose grade changes dramatically with minor input changes is not robust.
- Slippage and transaction-cost modeling: apply realistic fill assumptions, including spread, commission, and market impact, before evaluating any backtest result
Optiver's research is direct on the EV gap: models frequently fail to commit to positive-EV choices consistently, defaulting instead to conservative heuristics that reduce theoretical performance. This means a strategy that looks strong in backtesting may underperform in live trading not because the signal is wrong, but because the model's execution logic is suboptimal.
Pro Tip: Require the AI to produce an explicit invalidation level before any live entry. If the tool cannot specify the price at which the setup is no longer valid, the output is commentary, not a trade plan. Log every grade and outcome in a spreadsheet. After 30 trades, the correlation between grade and outcome will tell you more about the tool's reliability than any vendor claim.
Moving from AI signals to live execution
The gap between an AI-generated trade plan and a filled order involves several technical and operational layers that traders must address explicitly.
Integration types that connect AI analysis to live execution include webhook alerts (the tool sends a notification when a signal fires), REST APIs (the trader's system queries the tool programmatically), broker SDKs (direct connectivity to the execution venue), and middleware platforms that route signals to TradingView, MT4/MT5, or multi-account environments.
Execution considerations that AI tools typically do not address:
- Latency: the time between signal generation and order submission affects fill quality, particularly in fast-moving futures markets
- Order type selection: limit orders reduce slippage but risk missing fills; market orders guarantee execution but expose the trader to adverse price movement
- Protective broker-side stops: stops placed at the broker level remain active even if the trader's platform disconnects, a critical safeguard for automated or semi-automated workflows
- Fill reconciliation: confirming that executed fills match the model's assumed entry prices is necessary for accurate post-trade analysis
Operational guardrails that belong in any live AI-assisted trading setup include daily P&L lockouts (automatic suspension of trading activity when a loss threshold is reached), circuit breakers (position limits that prevent runaway losses in adverse conditions), and permissioning controls that restrict which accounts or instruments can receive automated signals.
SafeFly addresses these execution-layer requirements directly for futures traders on Tradovate. The platform's multi-account mirroring and broker-side protective stops ensure that every mirrored trade carries a protective stop at the broker level, and daily P&L lockouts enforce loss limits automatically. The OAuth Tradovate integration provides secure connectivity without requiring traders to share credentials. For traders running multi-account copy trading strategies, this execution infrastructure is the layer that AI analysis tools do not provide.

Can ChatGPT analyze charts and produce trade plans?
The short answer is yes for explanation and prototyping, and limited for chart-accurate, multi-step EV decisions without a dedicated vision and validation layer.
General-purpose LLMs like ChatGPT are useful in trading workflows for specific tasks:
- Strategy prototyping: generating code for indicator calculations or screening logic
- Indicator explanation: translating technical concepts into plain language for traders learning new tools
- Adversarial checklist generation: producing a structured list of conditions that would invalidate a trade thesis
- Narrative trade rationale: synthesizing multiple factors into a coherent written summary
The limitations are structural. LLMs do not natively parse chart images with the precision of a purpose-built vision model. When paired with a vision model, chart-reading capability improves substantially, but the output still requires validation against actual price data. Broker education resources confirm that LLMs can identify patterns and explain indicators but are not chart-vision systems in isolation.
Hallucinations in code and indicator explanations are a documented risk. A model that confidently explains an incorrect formula or misidentifies a pattern can cause more damage than no analysis at all, because the confident framing suppresses the trader's skepticism.
The practical path forward: pair an LLM with a chart-vision model or use a purpose-built screenshot analysis tool for structured entry, stop, and target outputs. Use the LLM for the adversarial checklist and narrative rationale. Keep the two functions separate.
A practitioner's view on integrating AI into a disciplined trading process
The traders who extract consistent value from AI trade analysis tools share a common characteristic: they use the AI to challenge their thesis, not to generate one. The morning workflow that works looks like this. A scan surfaces ten to fifteen setups meeting basic criteria. The AI grades each one and produces a structured output. The trader reviews the top five grades, runs the adversarial prompt on each, and eliminates any setup where the bear case is more compelling than the bull case. Two or three setups survive. Those are the ones that go to the backtest check.
What separates disciplined AI-assisted trading from the automation trap is the human checkpoint at every stage. Position sizing is never delegated to the model. Daily P&L lockouts are set before the session opens, not after a loss. Post-trade review is logged, not skipped.
For futures traders managing multiple Tradovate accounts, the execution layer adds another dimension of complexity. Manually replicating a trade across several accounts while maintaining consistent stop placement is operationally difficult and introduces the human error that AI analysis is supposed to reduce. SafeFly's broker-side protective stops and multi-account mirroring address this directly: every mirrored position carries a stop at the broker level, and the OAuth integration keeps the connection secure. The AI produces the plan. SafeFly enforces the execution.
SafeFly gives multi-account futures traders execution controls AI analysis cannot
AI analysis produces a trade plan. Executing that plan consistently across multiple accounts, with protective stops in place and daily loss limits enforced, requires infrastructure that most AI tools do not include.
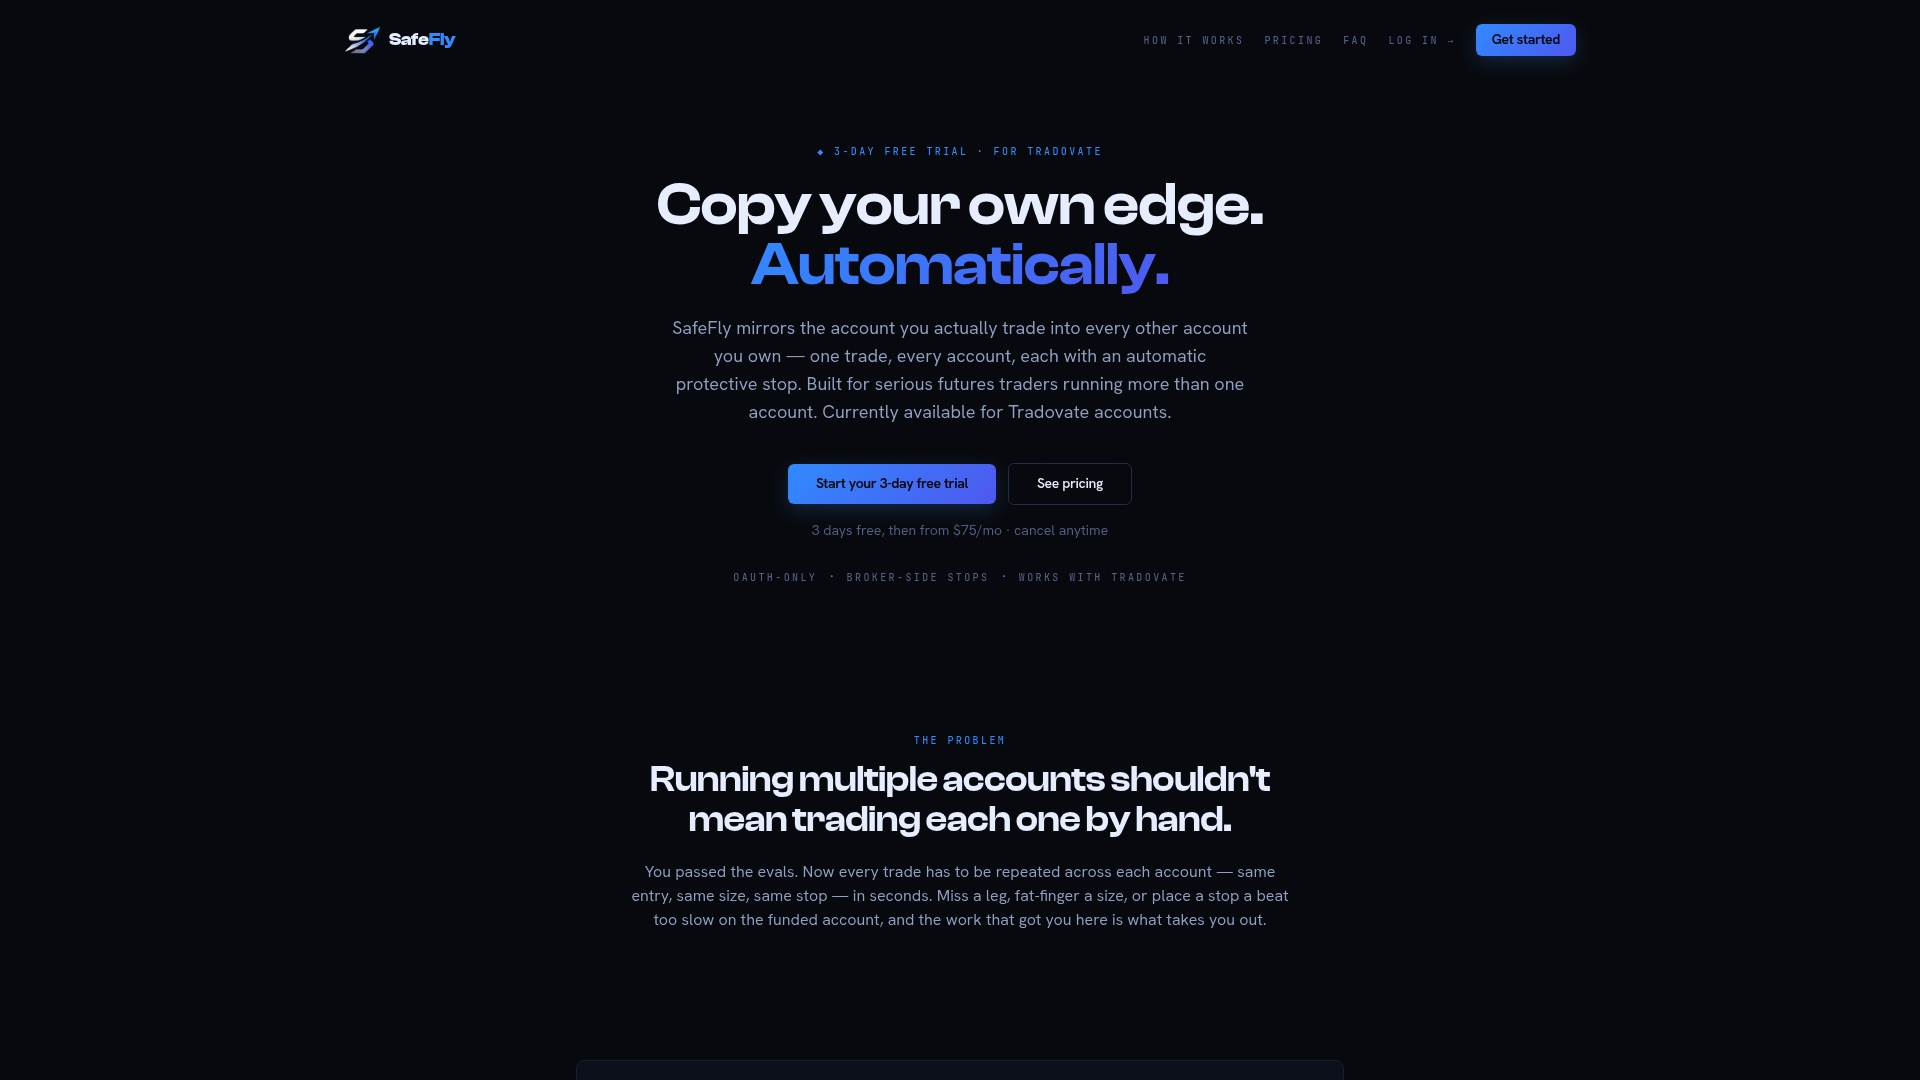
SafeFly is built specifically for futures traders running multiple Tradovate accounts who need that execution layer. Core capabilities include multi-account trade mirroring from a single lead account, broker-side protective stops that remain active even during platform disconnections, OAuth Tradovate integration for secure connectivity, daily P&L lockouts that suspend trading automatically at a defined loss threshold, and detailed trade analytics with AI coaching to support ongoing performance review. The platform's risk disclosure is publicly available for traders who want to review operational safeguards before subscribing.
Traders who want to see how SafeFly handles execution and risk controls can review the full feature set and subscription pricing, which includes a 3-day trial period.
Sources
The following sources were used to build this article and are recommended for traders who want to go deeper on specific topics.
- Where AI trading models work (and where they still fall short)
- AI for Trading: How It Works, Uses, Risks, and Skills Guide
- AI Chart Analysis Tool for Trading Screenshots
- Trading AI — AI Chart Analysis App | Free for Traders
- TradingAgents: A Multi-Agent LLM Trading Desk | MoClaw Blog
This article is general information, not a substitute for advice from a qualified financial advisor. Consult a qualified financial professional about your own circumstances before acting on anything here.