

The best time to trade futures falls within two high-probability windows in U.S. Eastern Time: the London–New York overlap and U.S. cash open (roughly 8:00–11:30 AM ET) and the final-hour rebalancing window (approximately 2:00–4:00 PM ET). These periods concentrate institutional order flow, tighten bid/ask spreads, and produce the clearest price signals across most major contracts.
- 8:00–9:30 AM ET (London–NY overlap, pre-open): Highest liquidity for equity index, FX, and metals futures. Scalpers and momentum traders benefit most.
- 9:30–11:00 AM ET (U.S. cash open): Peak volume for equity index futures (ES, NQ, RTY). Ideal for opening-range breakouts and intraday momentum setups.
- 2:00–4:00 PM ET (final-hour rebalancing): Institutional portfolio rebalancing drives a secondary volume spike. Momentum and swing traders find reliable directional follow-through here.
- Overnight/ETH (6:00 PM–8:00 AM ET): Wider spreads and lower volume. Suitable for swing and position traders accepting reduced fill quality for broader directional exposure.
The single most reliable rule in futures timing: trade when institutions are active. The London–New York overlap and the U.S. cash open are where institutional flow concentrates, spreads tighten, and signals carry the most weight. Every other window is a trade-off.
Key Takeaways
The two highest-probability windows for futures trading are the London–New York overlap and U.S. cash open (8:00–11:00 AM ET) and the final-hour rebalancing window (2:00–4:00 PM ET), with the correct window varying by strategy and asset class.
| Point | Details |
|---|---|
| Primary trading windows | The 8:00–11:00 AM ET overlap and 2:00–4:00 PM ET rebalancing window offer the tightest spreads and highest institutional volume. |
| Midday lull risk | The 11:30 AM–2:00 PM ET window produces thin liquidity and unreliable technical signals; reduce size or avoid directional trades. |
| Strategy-window alignment | Scalpers belong in the morning overlap; swing traders may use overnight sessions while accepting wider spreads. |
| Backtest before committing | Tag trades by entry hour, measure win rate and slippage per bucket, and exclude hours where edge rate turns negative for two consecutive months. |
| SafeFly for multi-account execution | SafeFly mirrors trades across Tradovate accounts with broker-side stops and daily P&L lockouts, preserving execution quality during peak windows. |
This article is general information, not a substitute for advice from a qualified financial advisor. Consult a qualified financial professional about your own circumstances before acting on anything here.
Table of Contents
- How CME Globex hours actually work
- Why liquidity and volatility peak at specific times
- How the best hours differ by asset class
- Matching your strategy to the right time window
- When to avoid trading and the risks by window
- How to test which hours actually work for your setup
- Applying optimal windows when you manage multiple accounts
- Pre-trade checklist and time zone conversion reference
- A note on time-based edges and execution discipline
- SafeFly keeps your execution consistent across peak windows
- Sources
How CME Globex hours actually work
CME Globex operates nearly 23 hours daily, Sunday 6:00 PM ET through Friday 5:00 PM ET, but near-continuous access does not mean near-continuous liquidity. A daily 60-minute maintenance break runs from approximately 5:00–6:00 PM ET, during which order entry is suspended and open positions carry gap risk.
The distinction between Electronic Trading Hours (ETH/Globex) and Regular Trading Hours (RTH) matters for equity index futures in particular. RTH for products like the E-mini S&P 500 (ES) runs 9:30 AM–4:00 PM ET, matching the NYSE and Nasdaq cash session. Globex access begins at 6:00 PM ET the prior evening, but volume during those overnight hours is a fraction of what RTH produces.
Key session reference points:
- Globex open (Sunday): 6:00 PM ET
- Daily maintenance break: 5:00–6:00 PM ET (all weekdays)
- RTH for equity index futures: 9:30 AM–4:00 PM ET
- London session open (approximate): 3:00 AM ET
- London–NY overlap: 8:00–11:30 AM ET
- U.S. cash close: 4:00 PM ET
Why liquidity and volatility peak at specific times
Institutional order flow does not distribute evenly across a 23-hour session. It clusters where multiple major markets are simultaneously open and active. The London–New York overlap (8:00–11:30 AM ET) and the afternoon rebalancing window (2:00–4:00 PM ET) consistently show the most reliable volume and tightest spreads across multiple futures contracts.
Three structural forces drive those peaks. First, session overlaps bring competing institutional participants into the same window, increasing order depth and compressing spreads. Second, scheduled macro releases drop into these windows by design: NFP and CPI print at 8:30 AM ET, the EIA petroleum status report hits at 10:30 AM ET on Wednesdays, and FOMC decisions typically fall in the early afternoon. Each release compresses spreads in the seconds before the number, then expands them violently for a brief period, before institutional absorption restores order. Third, end-of-day rebalancing by mutual funds, ETFs, and pension accounts creates predictable directional pressure in the final 30–60 minutes of the RTH session.
| Window (ET) | Typical Volume | Avg. Spread | Volatility Character |
|---|---|---|---|
| 6:00 PM–8:00 AM | Low | Wide | Directional drift, thin book |
| 8:00–9:30 AM | High (rising) | Tightening | News-driven spikes, overlap flow |
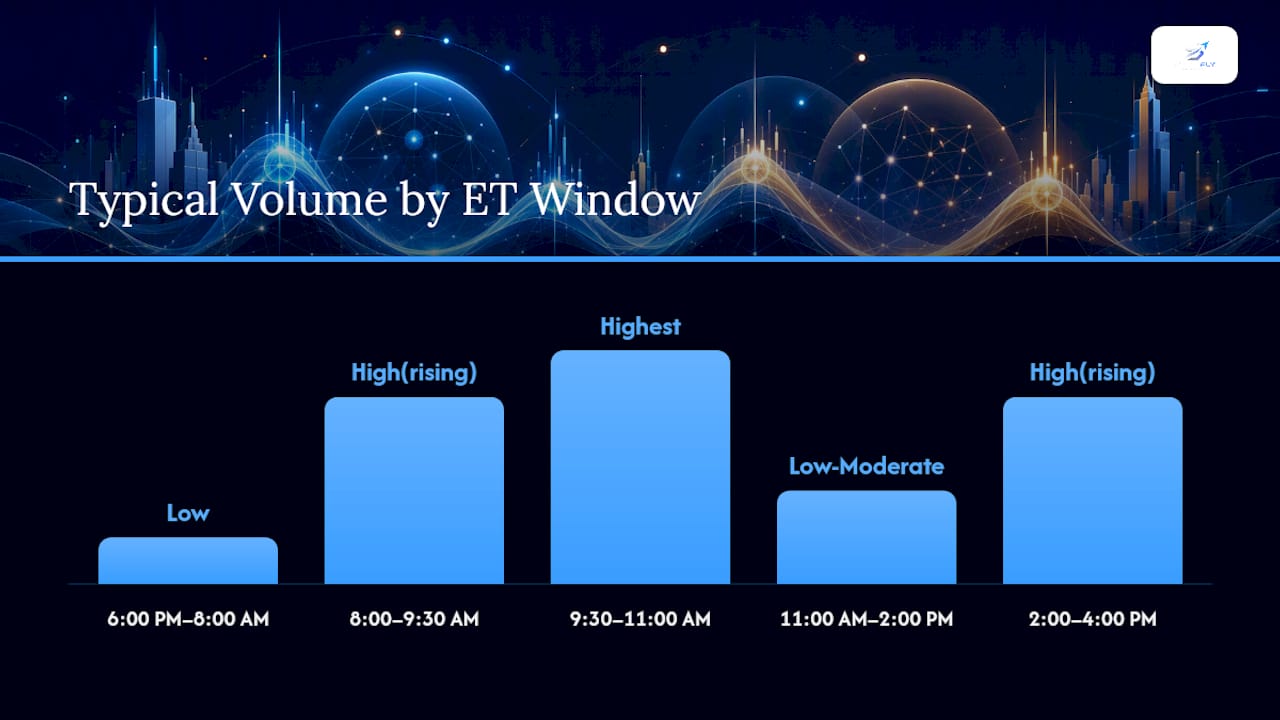
| 9:30–11:00 AM | Highest | Tightest | Breakout, momentum, high signal |
| 11:00 AM–2:00 PM | Low–Moderate | Widening | Range-bound, noise-heavy |
| 2:00–4:00 PM | High (rising) | Tight | Rebalancing, directional follow-through |
| 4:00–5:00 PM | Declining | Widening | Post-close, thin |
Pro Tip: *Before entering a trade, pull your platform's time-and-sales or volume histogram filtered to the prior 10 sessions. Compare realized spread (ask minus bid at fill) against average true range for that hour.
How the best hours differ by asset class
The optimal trading hours for futures vary meaningfully by product. A single schedule does not serve equity index traders and energy traders equally.
Equity index futures (ES, NQ, RTY, YM)
The U.S. cash open (9:30–11:00 AM ET) and the final hour (approximately 3:00–4:00 PM ET) produce the highest institutional volume for equity index contracts. The London–NY overlap (8:00–9:30 AM ET) is also productive for pre-market gap setups and news-driven positioning. Avoid the midday window (11:30 AM–2:00 PM ET) for directional plays; volume thins and technical levels become unreliable.
Energy futures (CL, NG)
Crude oil and natural gas futures are sensitive to European session activity (3:00–8:00 AM ET) and to scheduled government reports. The EIA petroleum status report, released Wednesdays at 10:30 AM ET, regularly produces the highest single-minute volume spikes for crude oil. Natural gas traders watch the EIA natural gas storage report, released Thursdays at 10:30 AM ET. Outside those report windows, the London–NY overlap is the primary high-quality period for energy contracts.
Metals and FX futures (GC, SI, 6E, 6J)
Gold and silver futures track London activity closely. The London open (approximately 3:00–4:00 AM ET) and the London–NY overlap (8:00–11:30 AM ET) are the primary windows for metals. FX futures (euro, yen, pound) follow a similar pattern, with the overlap producing the tightest spreads and deepest books.
Agricultural futures (ZC, ZS, ZW)
Grain and oilseed futures are driven by USDA reports (WASDE, crop progress, export sales), which typically release at 8:30 AM or 12:00 PM ET. Day-of-week effects are also more pronounced in ags: Monday crop progress reports and Friday export sales create recurring volume spikes. Outside report days, the morning RTH window (9:30–11:00 AM ET) is the most active period.
Treasury futures (ZN, ZB, ZF)
Treasury futures trade actively during the London session and the U.S. morning, with volume peaking around 8:30 AM ET when economic data releases. The afternoon window is less pronounced for fixed income than for equities, though FOMC days create a secondary spike at the 2:00 PM ET announcement.
Matching your strategy to the right time window
Matching time to strategy is not optional for active futures traders. The same setup that works at 9:45 AM ET will produce different results at 12:30 PM ET, and the difference is structural, not random.
Scalping
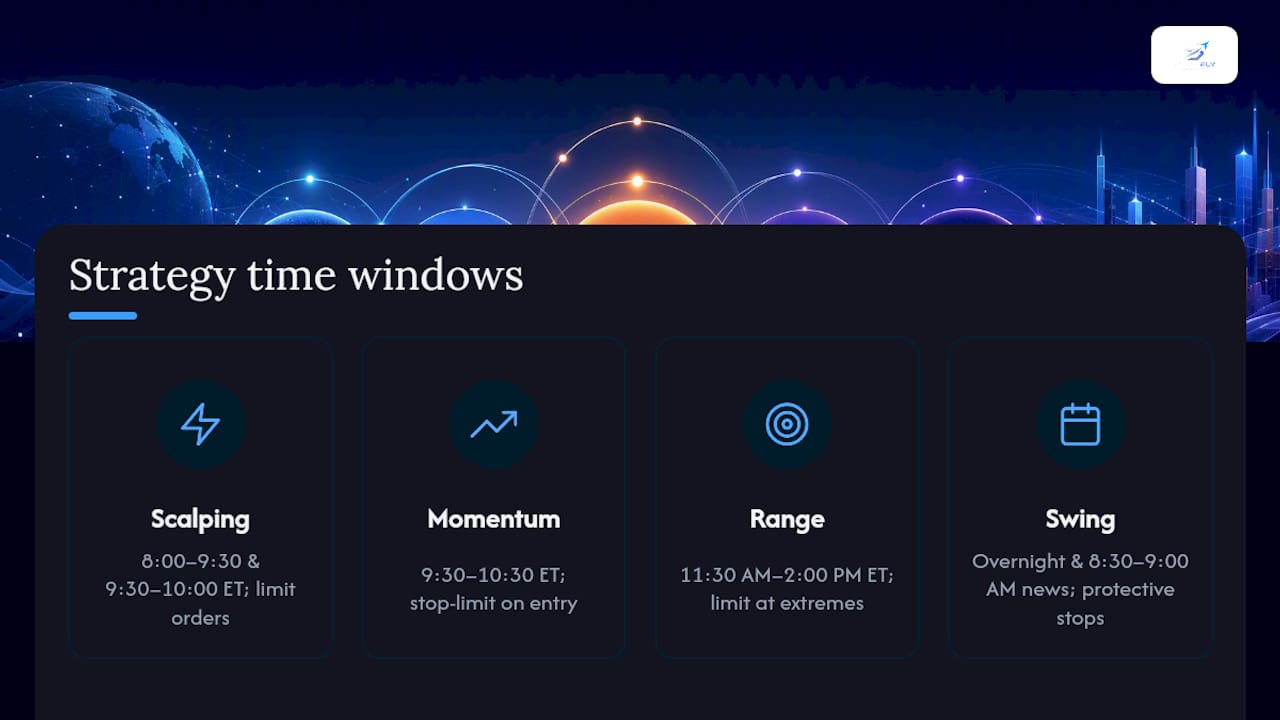
Scalpers require tight spreads and deep order books to capture small per-contract edges. The London–NY overlap (8:00–9:30 AM ET) and the first 30 minutes of the cash open (9:30–10:00 AM ET) are the primary windows. Limit orders are strongly preferred; market orders during this period carry meaningful slippage risk on fast-moving contracts. Keep position size consistent and enforce a per-session loss limit before entering.
Momentum and opening-range breakouts
The cash open (9:30–10:30 AM ET) is the primary window for opening-range breakout strategies. Price establishes a range in the first 15–30 minutes, and breakouts from that range with volume confirmation carry the highest follow-through probability. Stop-limit orders on entry reduce the risk of chasing a breakout at a poor fill. The 10:00–11:00 AM ET window often provides a secondary momentum leg after the initial open volatility settles.
Range and mean-reversion
The midday window (11:30 AM–2:00 PM ET) is the natural home for range and mean-reversion setups. Volume is lower, price oscillates within a tighter band, and institutional directional conviction is minimal. Limit orders at range extremes with defined profit targets work better here than breakout entries. The trade-off is that false breakouts are frequent, so confirmation filters (volume, time at level) reduce noise.
Swing and position trades
Swing traders may use overnight sessions for broader directional positioning, accepting wider spreads in exchange for exposure to gap moves and overnight news. The post-news window following a major release (8:30–9:00 AM ET on data days) also offers swing entry opportunities when a clear directional bias is established. Stop-limit orders on entry and broker-side protective stops on open positions are standard practice for overnight holds.
Pro Tip: Use limit orders during the cash open and overlap windows to control entry price. Switch to stop-limit orders for breakout entries to avoid fills at the extreme of a spike. Reserve market orders only for emergency exits during high-liquidity periods when the cost of delay exceeds the cost of slippage.
When to avoid trading and the risks by window
Not every hour on the Globex clock is worth trading. Several windows carry structural risks that regularly produce poor fills, unreliable signals, and unnecessary losses.
The midday lull (approximately 11:30 AM–2:00 PM ET)
Volume drops sharply after the morning session. Bid/ask spreads widen relative to the cash open, and institutional participation falls. Technical levels that held during the morning often break on low volume, creating false signals. Traders running momentum or breakout strategies during this window frequently encounter range traps: price moves through a level, triggers entries, then reverses without follow-through. Reducing position size or stepping away entirely during this window is a defensible risk-management decision.
The daily maintenance gap (5:00–6:00 PM ET)
CME Globex suspends order entry during the daily maintenance break. Any open position during this window carries gap risk: price can reopen materially different from where it closed. Pending orders placed before the break may not execute as expected. Traders should resolve open positions or confirm that protective stops are in place before 5:00 PM ET.
Overnight and off-hours sessions
Overnight liquidity is materially lower than RTH, and bid/ask spreads are wider. Technical indicators calibrated to RTH data produce inaccurate signals when applied to overnight price action. One-sided algorithmic flow is more common in thin overnight books, which can inflate slippage on both entry and exit. Traders using RTH-based setups (VWAP, opening-range, gap fade) should restrict those strategies to RTH data and RTH hours.
Trading during low-liquidity windows does not just increase costs — it changes the statistical character of price action. Signals that are reliable during the cash session become noise during the midday lull and overnight. Applying the same strategy across all hours without adjustment is one of the most common and costly errors in futures trading.
Review SafeFly's risk disclosure for a detailed account of how low-liquidity periods affect slippage and operational risk in multi-account environments.
How to test which hours actually work for your setup
Backtests across multiple futures contracts find that much intraday price action is statistically close to random, though structural time and seasonality filters can reveal exploitable edges for disciplined traders. The implication is direct: do not assume the BLUF windows apply to your specific instrument and setup without verification.
Step-by-step backtest checklist:
- Select your data set. Use RTH data for equity index, agricultural, and Treasury strategies. Use 24-hour data only if your strategy explicitly trades overnight sessions. Minimum sample: 252 trading days (one calendar year) per contract.
- Tag each trade by entry hour. Assign each historical trade or signal to a one-hour bucket (e.g., 9:00–10:00 AM ET, 10:00–11:00 AM ET, etc.).
- Calculate per-hour metrics. For each bucket, compute: total trade count, win rate, average profit/loss per trade, average slippage (entry fill vs. signal price), and average spread at entry.
- Apply a minimum sample filter. Exclude any hour bucket with fewer than 30 trades. Small samples produce unreliable statistics.
- Identify exclusion thresholds. Flag any hour where win rate falls below your strategy's breakeven threshold or where average slippage exceeds 15% of average profit. Those hours are candidates for exclusion from your live schedule.
- Validate out-of-sample. Reserve the most recent 60 trading days as a hold-out set. Run the filtered schedule against that data before applying it live.
| Metric | Definition | Exclusion Threshold |
|---|---|---|
| Win rate by hour | Percentage of profitable trades in that hour bucket | Below strategy breakeven |
| Avg. slippage | Fill price minus signal price, averaged per trade | Above 15% of avg. profit |
| Avg. spread at entry | Bid/ask spread recorded at entry time | Above 20% of ATR for that hour |
| Edge rate | (Win rate × avg. win) minus (loss rate × avg. loss) | Negative for two consecutive months |
Applying optimal windows when you manage multiple accounts
Executing during high-liquidity windows is straightforward with a single account. Managing multiple accounts simultaneously introduces synchrony risk: a delay of even a few seconds between a lead account fill and a mirror account fill can produce materially different average prices during fast-moving cash-open conditions.
Multi-account execution checklist for peak windows:
- Confirm all accounts are connected and authenticated before the window opens.
- Verify that broker-side protective stops are set on all positions, not just the lead account.
- Enforce daily P&L lockouts per account so a single bad fill in one account does not cascade into overtrading across the group.
- Use a single lead signal source; avoid manual overrides on mirror accounts during active windows.
- Log fill times and prices across all accounts after each session to identify synchrony drift.
When evaluating automation tools for multi-account execution, prioritize: secure OAuth authentication (not credential sharing), broker-side stop placement (not just platform-level stops), real-time analytics by account, and configurable daily loss limits. SafeFly's multi-account replication architecture addresses each of these requirements directly for Tradovate users.
Pro Tip: During the cash open (9:30–10:00 AM ET), order flow is fastest and fill divergence between accounts is highest. Schedule your lead account's entry signals to fire at least one full second after the trigger condition is confirmed, not at the exact tick. This small delay reduces the probability of mirror accounts filling at the extreme of a spike.
Pre-trade checklist and time zone conversion reference
Before entering any trade, verify the following regardless of which window you are targeting:
- Liquidity check: Confirm current bid/ask spread is within your threshold for that window. If spread is elevated, wait or reduce size.
- News calendar: Check the economic calendar for releases in the next 30 minutes. If a high-impact event is pending, decide in advance whether to hold through it or exit before.
- Margin verification: Confirm available margin covers the position plus a buffer for adverse movement. Intraday margin requirements differ from overnight requirements on most futures contracts.
- Stop placement: Set a protective stop before or immediately at entry. Do not enter without a defined exit.
- Session confirmation: Verify you are trading within your tested and approved hour buckets. If the current time falls outside those buckets, pass on the trade.
ET to local time conversion for primary trading windows:
| Window (ET) | Central (CT) | Mountain (MT) | Pacific (PT) |
|---|---|---|---| | 8:00–9:30 AM | — | 6:00–— | 5:00–6:30 AM | | 9:30–11:00 AM | 8:30–10:00 AM | 8:00–9:30 AM | 6:30–8:00 AM | | 2:00–4:00 PM | 1:00–3:00 PM | 12:00–2:00 PM | 11:00 AM–1:00 PM |
Additional operational notes:
- Use limit orders as your default entry type during high-liquidity windows to control fill price.
- Review your platform's route selection settings; direct-access routing typically produces faster fills during the cash open than smart-order routing.
- Set calendar alerts for recurring high-impact releases (NFP first Friday of each month, EIA Wednesdays at 10:30 AM ET, FOMC eight times per year).
A note on time-based edges and execution discipline
The framework in this article reflects a consistent finding across professional futures trading: session selection is one of the few structural edges that does not require a proprietary signal. Trading during the London–New York overlap and the U.S. cash open does not guarantee profitability, but it does guarantee that the conditions for profitability are present: deep books, tight spreads, and institutional participation that gives price moves meaning.
The more important point is that no universal answer exists for every trader and every instrument. The windows identified here are starting points, not conclusions. A scalper trading the E-mini S&P 500 and a swing trader in crude oil operate in different structural environments even when they share a clock. The backtest framework in this article exists precisely because the right answer for your setup requires your data, not a generalized recommendation.
Execution discipline during the correct window matters as much as window selection. Entering at the right hour with a market order during a thin book, or holding through a maintenance gap without a protective stop, negates the structural advantage the window provides. Timing and execution quality are not separable.
SafeFly keeps your execution consistent across peak windows
Identifying the best trading windows is the analytical half of the problem. Executing consistently across multiple Tradovate accounts during those windows is the operational half, and it is where human error concentrates.
SafeFly automates trade replication from a lead account to mirror accounts, placing broker-side protective stops on every position automatically. If a connection drops during the cash open, positions remain protected. Daily P&L lockouts prevent a single bad session from compounding across accounts. The platform's secure OAuth integration eliminates credential sharing, and its trade analytics surface per-account fill quality so you can measure synchrony drift after each session.
For traders who have done the work of identifying their optimal windows and want execution that holds up under real market conditions, SafeFly's 3-day trial is the logical next step. Review the full feature set and start a trial at Safefly.
Sources
- Futures Market Hours: Best Trading Times (2026) | TradingSim
- What Are The Best Trading Hours for Futures | Prop Firm Switch
- Quantifiedstrategies