

Maximum Adverse Excursion (MAE) is the largest unrealized loss a trade accumulates between entry and exit, measured before the position closes. Traders use it primarily to set data-driven stop distances, size positions against real historical risk, and diagnose whether a strategy's losers are cut early enough. John Sweeney introduced the concept in 1996, and MAE remains a retrospective metric. It tells you what already happened to past trades, which is exactly why it's useful for designing what happens to future ones.
Key Takeaways
Stop distances set from a validated MAE percentile outperform arbitrary stops because they're anchored to how your actual winners have historically behaved.
| Point | Details |
|---|---|
| MAE measures single-trade risk | It captures the worst unrealized loss in one position, not account-wide drawdown. |
| Use percentiles, not averages | Set stops beyond the 90th or 95th percentile of winners' MAE for a data-backed distance. |
| Normalize before comparing | Convert MAE to R-multiples, ATR multiples, or percentage terms across instruments. |
| Validate out-of-sample | Test any new stop threshold on unseen trades before trading it live. |
| Automate enforcement | SafeFly applies broker-side protective stops and daily P&L lockouts so MAE-derived rules execute consistently across mirrored accounts. |
Table of Contents
- What Is Max Adverse Excursion and How Does It Differ From Drawdown?
- How Do You Calculate Max Adverse Excursion?
- MAE vs MFE: What Do the Two Metrics Together Reveal?
- Using Max Adverse Excursion for Stops and Position Sizing
- How to Compute Max Adverse Excursion in Backtests
- Where Does Max Adverse Excursion Analysis Go Wrong?
- A Step-by-Step Checklist for Setting Stops With MAE
- How Automation Turns MAE Rules Into Enforced Policy
- An Editorial Take on MAE-Driven Stops
- Enforce Your MAE-Based Stops Without Manual Replication
- Frequently Asked Questions
- Sources
What Is Max Adverse Excursion and How Does It Differ From Drawdown?
Sweeney developed MAE as a way to quantify the worst unrealized loss a single open position experiences before it closes, whether that close is a winner or a loser. The concept, laid out in his foundational work on price fluctuation analysis, gave traders a repeatable, statistical alternative to guessing where a stop "feels" right.
MAE and drawdown answer different questions. Drawdown measures how far your account equity falls from a peak, aggregating every open position and every closed trade over time. MAE isolates one trade and asks: how underwater did this position get before it recovered or got stopped out?
- MAE: worst unrealized loss within a single trade
- Drawdown: worst peak-to-trough decline across the whole account or strategy
Because MAE is calculated after the trade closes, it gives you a clean, backward-looking dataset. That history is what lets you build forward-looking stop rules instead of reacting emotionally in real time.
How Do You Calculate Max Adverse Excursion?
The price-based formula depends on trade direction. For a long trade, MAE equals entry price minus the lowest price reached while the position was open. For a short trade, MAE equals the highest price reached minus the entry price. Both figures should always be zero or positive, since MAE measures a loss regardless of how the trade eventually closed.
You can express MAE several ways depending on what you're optimizing:
- Dollar terms: MAE in price units multiplied by contract size or shares
- R-multiples: MAE divided by your initial risk-per-trade unit
- Percentage: MAE as a share of the stop distance, useful for comparing trades with different stop widths
If you're working from an equity curve rather than raw price, running P&L based MAE tracks the lowest point your unrealized profit and loss reaches after entry, before eventual exit. This method matters for strategies with multiple contracts, scaling entries, or fees that shift breakeven.
Sampling resolution matters more than most backtesters assume. Daily bars hide intrabar spikes that would have triggered a stop on tick or one-minute data, which understates real MAE. Whenever possible, calculate MAE from the finest resolution your data provider offers.
MAE vs MFE: What Do the Two Metrics Together Reveal?
Maximum Favorable Excursion (MFE) is MAE's mirror image: the largest unrealized profit a trade reaches before exit. Where MAE tells you how much pain a trade caused, MFE tells you how much opportunity it offered.
Reading them together exposes patterns a single metric hides:
- Low MAE, high MFE: clean entries that move quickly in your favor, ideal setups
- High MAE, high MFE: volatile trades that eventually work but test your nerve and your stop
- High MAE, low MFE: entries with poor timing that never really had room to breathe
- Bimodal MAE distribution: a sign your strategy contains two distinct trade types worth separating
Analyzing winners and losers separately is worth the extra step. Winners' MAE tells you how much heat a good trade can absorb; losers' MAE tells you how early you could have exited to save capital.
Using Max Adverse Excursion for Stops and Position Sizing
Percentile analysis turns MAE from a curiosity into an operating rule. The 90th and 95th percentiles are the two most commonly used cutoffs, balancing tightness against the risk of stopping out trades that would have recovered.
Stop optimization in practice looks like this: pull the MAE distribution for your last several dozen winning trades, find where the 90th percentile sits, and test a stop just beyond it. Traders who tighten stops to a validated percentile often improve their reward-to-risk ratio, though win rate can dip if the tightened stop clips trades that needed one more percentage point of room.
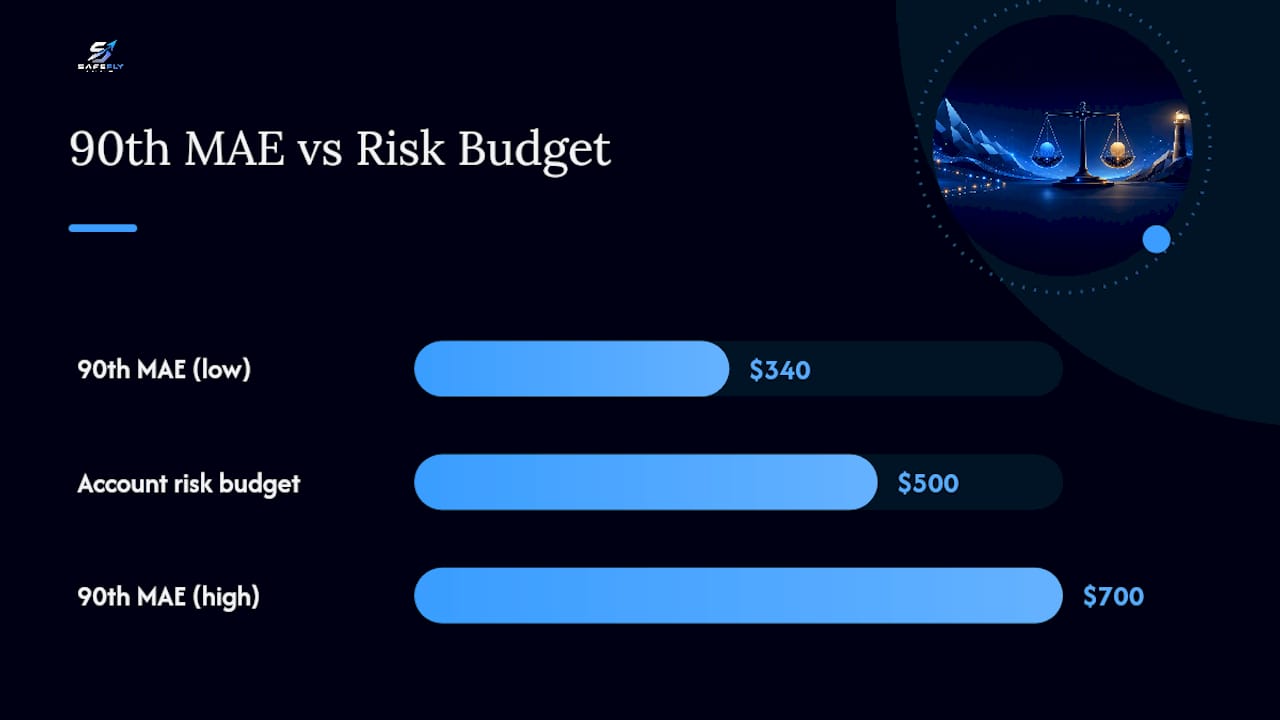
Position sizing follows the same logic in dollar terms. If your monetary MAE at the 90th percentile is $340 per contract and your account risk budget is $500 per trade, you can size up. If it's $700, you're already over budget before slippage.
Common MAE-driven rules traders apply:
- Set stops just beyond the 90th percentile MAE of historical winners
- Reduce size when monetary MAE approaches available margin buffer
- Flag any live trade whose MAE exceeds the historical 95th percentile for early review
- Separate MAE rules by instrument, since volatility profiles differ
Pro Tip: Don't set one stop rule across every instrument you trade. A percentile-based stop calibrated on the E-mini S&P will be far too tight for a crude oil contract with a different volatility profile.
How to Compute Max Adverse Excursion in Backtests
Before running any calculation, confirm your dataset includes five fields for every trade: entry time, entry price, the lowest and highest intra-trade price (or running P&L trough), exit time, and exit price. Missing intrabar data is the single most common reason backtested MAE understates real risk.
- Pull tick or one-minute bar data for the full holding period of each trade, not just daily closes.
- Calculate MAE per trade using the price-based or running-P&L formula that matches your data structure.
- Separate the resulting values into winners and losers before building any distribution.
- Plot both distributions and record the median, 90th, 95th, and 99th percentiles for each.
- Normalize every MAE value using R-multiples, ATR multiples, or percentage of stop distance so results are comparable across instruments.
A tight, low-variance MAE distribution generally signals a consistent strategy with stable volatility exposure. A wide, long-tailed distribution suggests either regime instability or a strategy overfit to a narrow historical window. Normalizing by ATR is particularly useful when comparing MAE across instruments with very different price scales, since a raw dollar figure means little without volatility context.
Where Does Max Adverse Excursion Analysis Go Wrong?
MAE is only as reliable as the data and sample size behind it. A few recurring mistakes undermine otherwise sound analysis:
- Lookahead and low resolution: coarse daily bars miss intrabar spikes that would have triggered a stop, making MAE look smaller than it really was.
- Small-sample overfitting: adjusting stops after a handful of trades mistakes noise for a genuine pattern.
- Regime dependence: MAE distributions shift when volatility regimes change, so a percentile calculated during a calm quarter won't hold during earnings season or a rate decision.
- Margin surprises: a monetary MAE that looks acceptable in pips can still trigger a margin call if position size wasn't recalculated for account leverage.
Pro Tip: Analyze a minimum sample of closed trades before touching your stop rules, and always validate any new threshold on out-of-sample data before trading it live.
A Step-by-Step Checklist for Setting Stops With MAE
- Collect entry price, exit price, and intra-trade high/low for every closed trade in the strategy.
- Compute MAE per trade using the correct long or short formula.
- Normalize each value into R-multiples or ATR multiples.
- Calculate the median, 90th, and 95th percentiles separately for winners and losers.
- Choose a stop distance just beyond the winners' 90th percentile MAE.
- Test the new stop on out-of-sample trades before committing capital.
- Deploy with reduced size first, then scale up once live MAE tracks the historical distribution.
That ratio tells you how many contracts you can hold without exceeding your risk tolerance. If live MAE starts exceeding the historical 95th percentile on a regular basis, that's a signal to scale down exposure or pause the strategy, not to widen the stop and hope conditions revert.
How Automation Turns MAE Rules Into Enforced Policy
A percentile-based stop only protects you if it executes exactly when it should, every time, even during a disconnection. That's where broker-side protective stops, automated trade mirroring, and daily P&L lockouts turn a spreadsheet rule into an enforced policy rather than a good intention.
Features worth looking for in any automation layer:
- Broker-side stops that persist even if your platform loses connection
- Secure OAuth account integrations rather than shared credentials
- Daily profit and loss lockouts tied to your MAE-derived risk budget
- Analytics that export MAE distributions and percentile reports for ongoing review
An audit trail matters too. When a stop rule changes, you want a record of why, backed by the percentile data that justified it.
An Editorial Take on MAE-Driven Stops
Data-driven stops beat gut-feel stops in almost every scenario worth trading. The harder discipline is resisting the urge to tighten a stop the moment MAE data suggests it, without running the out-of-sample check first. Traders who treat MAE as a living dataset, reviewed regularly rather than set once, are the ones who actually capture its edge.
Enforce Your MAE-Based Stops Without Manual Replication
Calculating the right stop distance from MAE data solves half the problem. Executing it consistently across every account you manage, every single time, solves the other half. SafeFly mirrors trades from a lead account to your other Tradovate accounts automatically, applying a broker-side protective stop to each one so your MAE-derived rule survives even a dropped connection.
Look for a few specific capabilities when evaluating automation for this purpose:
- Broker-side protective stops attached to every mirrored trade
- Daily profit and loss lockouts that enforce your risk budget automatically
- Secure OAuth connections instead of shared login credentials
- Detailed trade analytics and AI coaching to review performance against your MAE thresholds
For strategy validation before committing capital, resources like Sigma EA's backtesting tools and TradeAiFi's volatility analysis can help confirm your percentile-based stops hold up across different market conditions. Once you're ready to enforce those stops in live trading, see how SafeFly's automation works or review the platform's risk controls before connecting your accounts.
Frequently Asked Questions
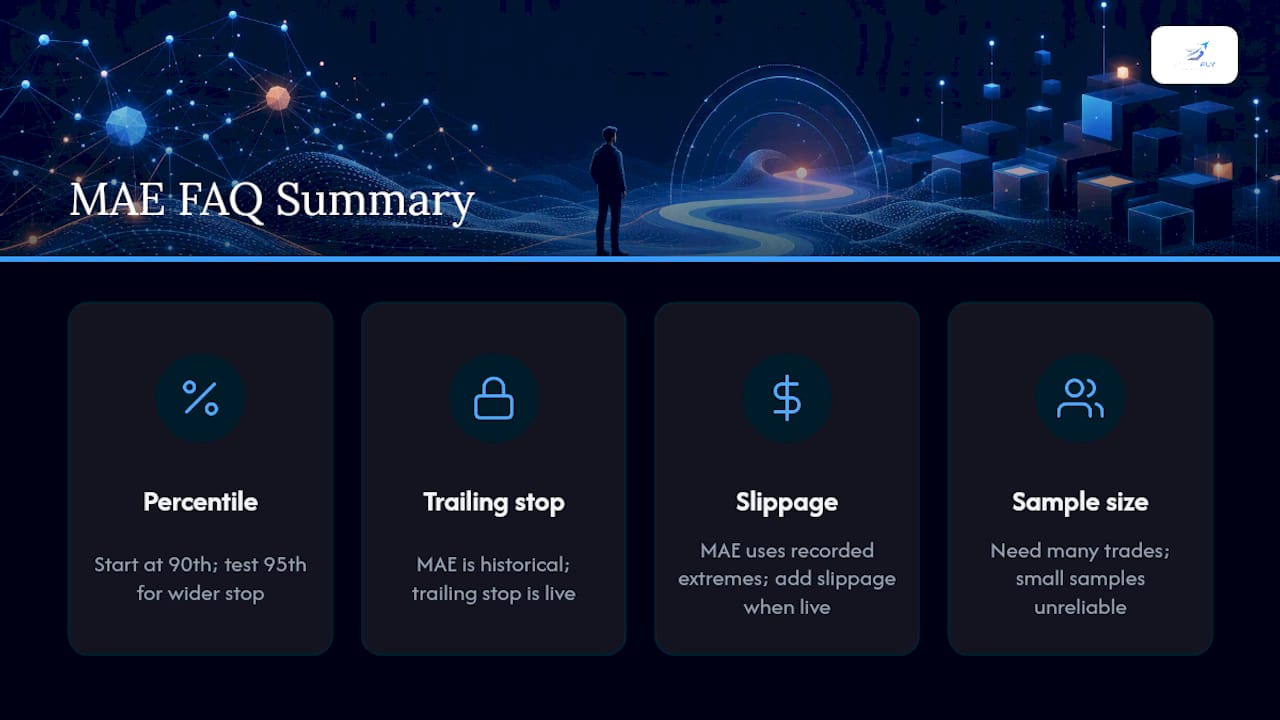
What is a good MAE percentile to use for setting stops? Most traders start with the 90th percentile of winning trades' MAE, then test the 95th percentile if they want a wider buffer. The right choice depends on your strategy's win rate and how much a tighter stop clips otherwise-profitable trades.
Does max adverse excursion account for slippage? Standard MAE formulas use the recorded price extreme, not the price you'd actually receive after slippage. Traders factor slippage in separately when converting MAE into a live stop distance.
How is max adverse excursion different from a trailing stop? MAE is a historical measurement calculated after a trade closes. A trailing stop is a live order mechanism. You use MAE data to decide how far a trailing or fixed stop should sit, but they measure different things.
Can MAE be negative? No. MAE always represents a loss magnitude, so it's expressed as zero or a positive value regardless of trade direction or outcome.
How many trades do I need before trusting my MAE data? More trades produce more reliable percentile estimates. A handful of trades isn't enough to distinguish a real pattern from random noise, so most traders wait for a larger, strategy-specific sample before adjusting stops.
This article is general information, not a substitute for advice from a qualified financial advisor. Consult a qualified financial professional about your own circumstances before acting on anything here.