

An ATR trailing stop places a protective exit a set multiple of the Average True Range away from price, adjusting automatically as volatility changes. For most futures timeframes, a 14-period ATR with a 1.5x to 2x multiplier is a reasonable starting point to test and refine. This range balances responsiveness against the whipsaws that plague tighter settings during normal price noise.
The logic is simple: multiply ATR by your chosen factor, then trail the stop only in the direction of the trade, never against it.
- 14-period ATR, 1.5x to 2x multiplier: a workable default for swing and intraday futures setups
- Widen the multiplier during high-impact news windows; tighten it in calm, range-bound conditions
- Recalculate position size every time the stop distance changes
Pro Tip: A wider ATR stop means fewer contracts at the same dollar risk. Never hold contract size constant while the stop distance moves.
Key Takeaways
An ATR trailing stop widens or tightens with market volatility, and pairing it with dynamic position sizing keeps dollar risk consistent as that stop distance changes.
| Point | Details |
|---|---|
| Start with 14-period ATR | Use a 1.5x to 2x multiplier as a baseline, then backtest against your specific contract. |
| Resize every time ATR shifts | Divide dollar risk by (stop distance x contract multiplier) to keep risk constant. |
| Trail only in your favor | The stop should move toward price on new highs or lows, never loosen on a pullback. |
| Widen around scheduled news | Increase your multiplier or reduce size ahead of high-impact reports instead of holding a static setting. |
| Automate across multiple accounts | SafeFly mirrors trades and applies broker-side stops to each linked Tradovate account automatically. |
Table of Contents
- What Is an ATR Trailing Stop in Futures Trading?
- How Do You Calculate an ATR Stop Step by Step?
- Which ATR Period and Multiplier Should You Use?
- How Should ATR Stops Affect Your Position Size?
- Setting Up ATR Trailing Stops on Your Platform
- How Does an ATR Trailing Stop Actually Update?
- ATR Stops vs. Fixed Dollar and Percentage Stops
- ATR Stops on Popular Futures Contracts
- How Do You Backtest an ATR Stop Strategy?
- Common Mistakes Traders Make With ATR Stops
- What Matters Most When Applying ATR Stops to Futures
- Automate ATR Stops Across Every Tradovate Account
- Frequently Asked Questions
- Sources
What Is an ATR Trailing Stop in Futures Trading?
An ATR trailing stop uses the Average True Range to size the distance between price and your exit, then moves that exit only in your favor as the trade develops. True range measures the largest of three values for a given bar: the current high minus the low, the high minus the previous close, or the low minus the previous close. ATR smooths that number over a lookback period, typically 14 bars, using Wilder's smoothing method.
Futures markets make this approach particularly useful. Contract-specific volatility varies wildly. Crude Oil can move $1,000 per contract in an afternoon on inventory data, while a bond future might barely twitch. A fixed dollar stop that works for one contract fails for another. ATR adapts automatically, scaling the stop to whatever that specific instrument is actually doing right now.
ATR-based trailing stops work best in these conditions:
- Trending markets where you want to stay in a position through normal pullbacks
- Swing trades held over multiple sessions where overnight gaps matter
- Any instrument where volatility shifts meaningfully across the trading day
The method struggles in tight, sideways chop, where price oscillates inside a narrow range and even a properly sized ATR stop gets clipped repeatedly. Know the regime before you trust the tool.
How Do You Calculate an ATR Stop Step by Step?
Calculating an ATR trailing stop takes four steps, and you can do it by hand or let your charting platform automate it.
- Calculate true range for each bar. Take the greatest of: today's high minus today's low, today's high minus yesterday's close, or today's low minus yesterday's close.
- Smooth true range into ATR. Most traders use a 14-period lookback with Wilder's smoothing, which weights recent bars more heavily than a simple average.
- Multiply ATR by your chosen factor. A common starting range is 1.5x to 2x, though this shifts with your timeframe and risk tolerance.
- Place or trail the stop. For a long position, subtract the result from the highest close since entry. For a short, add it to the lowest close since entry.
Here's a worked example using the E-mini S&P 500 (ES). Your stop distance is 22.00 x 2 = 44.00 points, placing the initial stop at 5,356.00. As price rallies to a new closing high of 5,430.00, the stop trails up to 5,386.00, but it never moves down while the trade is open.
For a short position, reverse the math: add the stop distance to the lowest close since entry, and only lower the stop as price falls further in your favor. This directional discipline is what separates a trailing stop from a static one, and it is the entire point of the exercise.
Which ATR Period and Multiplier Should You Use?
The period you choose changes how fast the stop reacts, and the multiplier changes how much room the trade gets before it exits. Neither number is universally correct. Both depend on your timeframe and how much noise you can tolerate.
A shorter ATR period reacts quickly to volatility spikes and suits fast intraday trading but can increase false signals. A longer period smooths volatility changes, suiting longer-term trading with slower reactions. The 14-period setting balances these tradeoffs and is commonly used.
Multiplier selection follows a similar tradeoff:
- 1.0x to 1.5x is aggressive, exiting fast but risking premature stop-outs on normal pullbacks
- 1.5x to 2.0x is balanced and works for most trend-following futures strategies
- 2.5x to 3.0x is conservative, giving trades room to breathe but tolerating larger drawdowns per position
Backtesting from The Planet Indicator suggests a 1.5x ATR multiplier often filters out whipsaw exits while still preserving meaningful trend exposure, a useful reference point rather than a rule.
Around scheduled events like Fed announcements or major inventory reports, temporarily widen your multiplier or reduce size instead of tightening the stop into a volatility spike you know is coming. Test any multiplier choice across at least 50 to 100 historical trades on your specific contract before committing real capital.
How Should ATR Stops Affect Your Position Size?
An ATR stop is only half the equation. The other half is how many contracts you trade given that stop's distance, and this is where most traders lose the plot. Widening your stop without shrinking your size means taking on more risk than you intended, often without realizing it until the loss hits.
The formula is straightforward:
- Set your dollar risk per trade as a fixed percentage of account equity, commonly 0.5% to 2%.
- Calculate stop distance in points using ATR times your multiplier.
- Divide risk dollars by (stop distance x contract multiplier) to get your contract count.
Here's the math applied to the earlier ES example. Say your account risk target is $500 per trade, the stop distance is 44.00 points, and the E-mini S&P contract multiplier is $50 per point. Dollar risk per contract equals 44.00 x $50 = $2,200. Since $500 divided by $2,200 is less than one, you'd trade a micro E-mini (MES) instead, where the multiplier is $5 per point, bringing per-contract risk to $220, allowing roughly two contracts within your target.
As ATR expands during volatile stretches, this formula automatically pushes you toward fewer contracts. That's the mechanism working correctly, not a flaw to override.
Pro Tip: Pair ATR-based sizing with an account-level daily loss lockout. Even perfect stop placement on individual trades won't save you from a string of losses compounding across a volatile session.
Setting Up ATR Trailing Stops on Your Platform
Most charting platforms, including thinkorswim and tastytrade, let you configure ATR trailing stops directly, but the input fields vary by platform. Run through this checklist before you go live:
- ATR period: typically 14, adjustable to 7 or 20+ depending on your strategy
- Multiplier: your chosen factor, commonly 1.5x to 2x
- Anchor price: whether the stop trails off the close, high, or low
- Order type: stop market for guaranteed fills, stop limit if you need price control
- Trail direction: confirm the platform only moves the stop in your favor, never against you
Native platform trailing stops work fine for a single account. The complexity multiplies the moment you're running the same strategy across several Tradovate accounts, where manually replicating an ATR-adjusted stop on each one introduces exactly the kind of human error that turns a well-designed system into a liability.
Automating ATR-based stops across multiple accounts reduces operational risk, and broker-side stops in particular prevent full exposure if your connection drops mid-session.
SafeFly addresses this by mirroring trades from a lead account to linked accounts automatically, applying broker-side protective stops to each one and enforcing daily profit and loss lockouts. Every connection runs through secure OAuth, and the how-it-works page documents the full mechanics. Before running any of this live, test your ATR settings on a simulated account and backtest against historical data specific to your contract, referencing NFA guidance on broker protections along the way.
How Does an ATR Trailing Stop Actually Update?
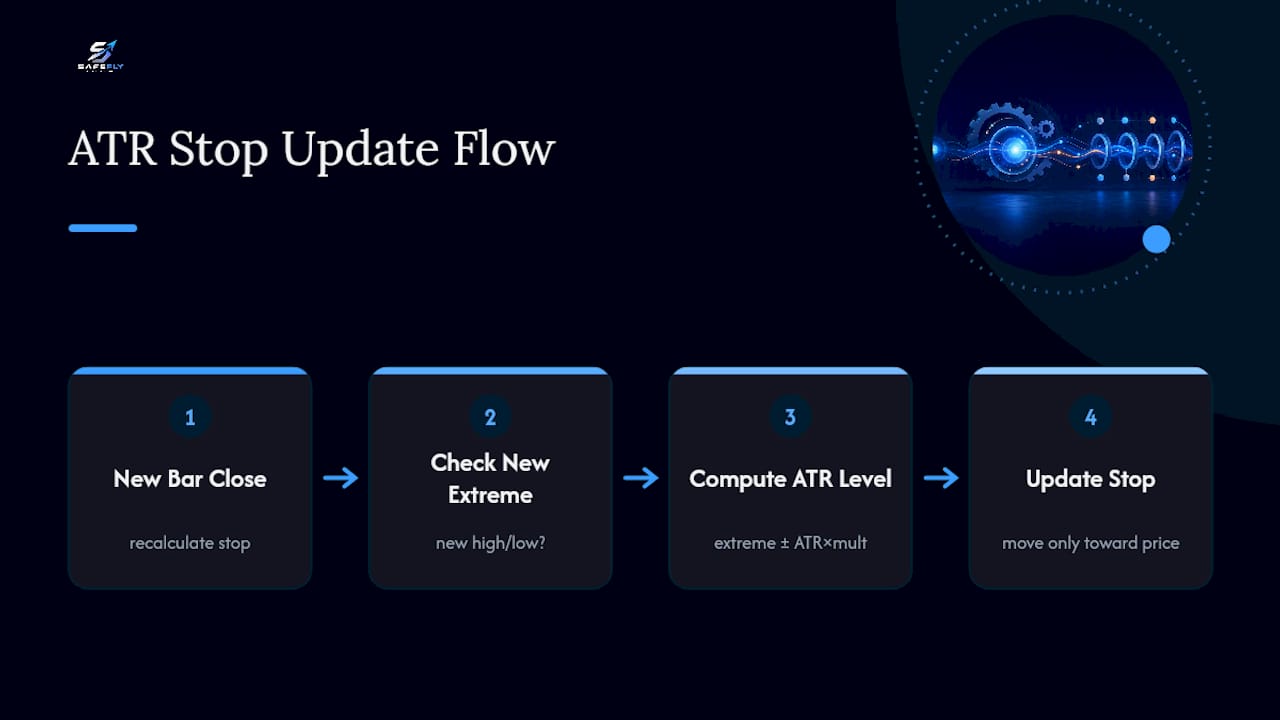
The rule governing an ATR trailing stop is deceptively simple: it moves only in the direction that favors your open position, and never against it. For a long trade, the stop can rise as price makes new highs, but it cannot fall back down even if price pulls back and the ATR calculation shifts. For a short trade, the stop can drop as price makes new lows, but it never rises.
This is the same logic behind the Chandelier Exit, a specific implementation that anchors the stop to the highest high (for longs) or lowest low (for shorts) since entry, then subtracts or adds a multiple of ATR from that extreme. The "chandelier" name comes from the visual: the stop hangs from the highest point of the trade like a chandelier from a ceiling, and it only moves up as the ceiling rises.
Practically, this means your trailing stop recalculates on every new bar close, checking two things: has price made a new favorable extreme, and if so, does the new ATR-adjusted level sit closer to price than the current stop. If both are true, the stop tightens toward price. If price pulls back without setting a new extreme, the stop holds its ground rather than loosening.
This move-only-in-favor discipline is what makes ATR trailing stops fundamentally different from a stop you manually reset. It locks in gains progressively without requiring you to babysit the trade, and it removes the temptation to second-guess a stop back out to "give the trade more room" once you're in a losing position.
ATR Stops vs. Fixed Dollar and Percentage Stops
Fixed dollar stops set a flat amount, say $300 per contract, regardless of what the market is doing. They're simple to calculate and easy to communicate, but they ignore volatility entirely. A $300 stop that's reasonable for Crude Oil on a quiet day gets run over instantly during an OPEC announcement, and that same $300 stop sits needlessly wide during a dead summer session.
Percentage-based stops improve on this slightly by scaling with price, typically 1% to 2% below entry. The problem is that price level and volatility aren't the same thing. Two contracts trading at the same price can have completely different ATR readings depending on how actively they're moving, so a percentage stop still misses the actual risk profile of the instrument.
ATR stops solve this by measuring what the market is actually doing right now rather than an arbitrary dollar figure or a static percentage of price. The tradeoff is complexity: ATR requires recalculation as new bars close, and it demands a bit more setup than typing "$300" into a stop field.
Here's how the three compare on the traits that matter most:
| Method | Adapts to volatility | Setup complexity | Best fit |
|---|---|---|---|
| Fixed dollar | No | Low | Consistent-volatility instruments, simple systems |
| Percentage-based | Partially | Low | Longer-term positions where price level matters more than daily swings |
| ATR-based | Yes | Moderate | Futures with variable volatility, trend-following strategies |
For futures traders juggling multiple contracts with different volatility characteristics, that adaptability is usually worth the extra setup step.
ATR Stops on Popular Futures Contracts
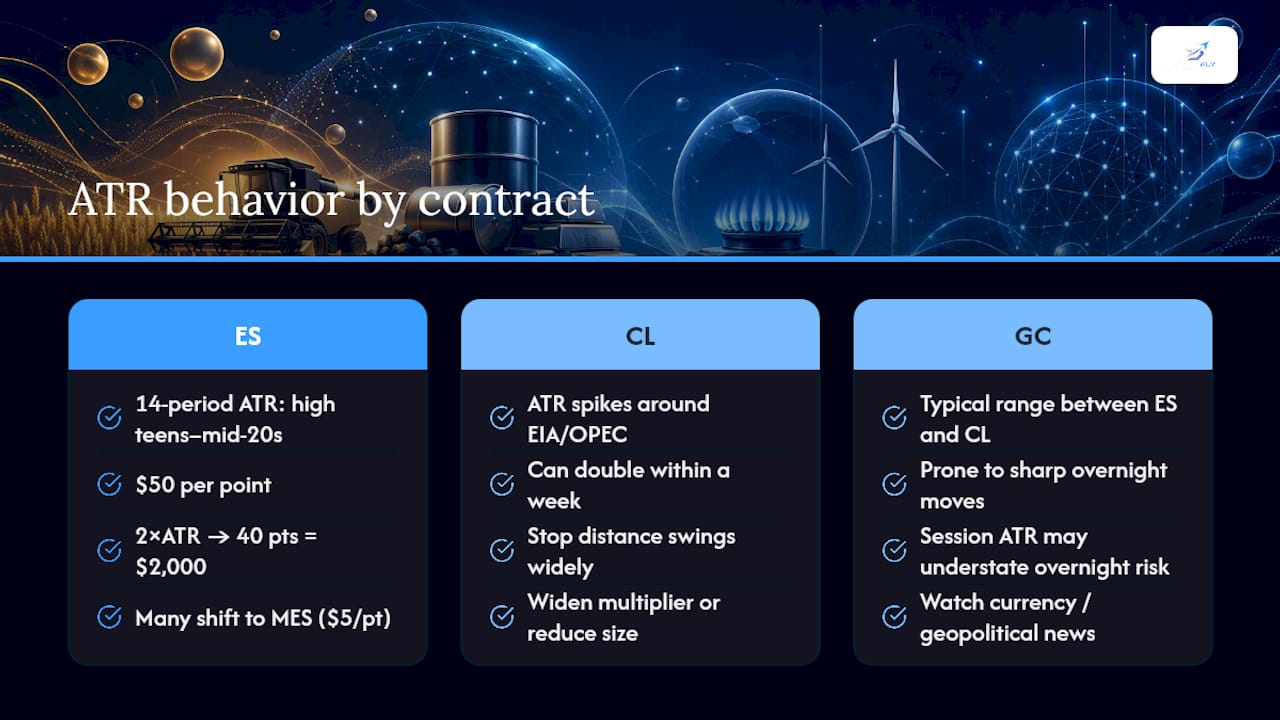
The mechanics stay consistent across contracts, but the numbers look very different depending on what you're trading. Take the E-mini S&P 500 (ES) again: on a moderate volatility day, a 14-period ATR might read somewhere in the high teens to mid-20s in points. At $50 per point, a 2x multiplier on an ATR of 20 puts your stop 40 points away, or $2,000 per contract, which is why many retail traders shift to the Micro E-mini (MES) at $5 per point for the same setup.
Crude Oil (CL) behaves differently. ATR readings expand sharply around EIA inventory data and OPEC meetings, sometimes doubling within a single week. A trader using a static multiplier without adjusting for this event calendar will find their stop distance swinging wildly from one week to the next, which is exactly why widening the multiplier or reducing size ahead of scheduled reports matters more here than in a steadier product.
Gold futures (GC) tend to sit between these two in terms of typical daily range, but they're prone to sharp overnight moves tied to currency and geopolitical news, meaning a session-only ATR calculation can understate real overnight risk if you're holding positions through the close.
The takeaway across all three: don't copy a multiplier or period setting from one contract to another without checking whether the underlying volatility behavior actually matches. What works on the ES on a calm Tuesday won't necessarily hold up on Crude Oil the morning of an inventory report.
How Do You Backtest an ATR Stop Strategy?
Backtesting an ATR stop strategy means running your period and multiplier choices against historical price data to see how they would have performed before risking live capital. Start with at least 100 trades' worth of history on the specific contract you plan to trade, since results from one instrument rarely transfer cleanly to another.
Track these metrics as you test:
- Win rate: the percentage of trades that closed profitably
- Average win versus average loss: whether your winners are large enough to offset losses at your actual win rate
- Maximum drawdown: the largest peak-to-trough equity decline during the test period
- Whipsaw rate: how often the stop triggers on noise before the underlying trend resumes
Run the same strategy across multiple multiplier settings, say 1.5x, 2x, and 2.5x, and compare drawdown against total return for each. A tighter multiplier usually improves win rate on paper but can quietly increase whipsaw exits that erode returns through commissions and slippage. A looser multiplier reduces whipsaws but increases the size of individual losses.
Test across different market regimes separately rather than lumping trending and sideways periods into one aggregate number. A multiplier that performs well during a strong trend can perform poorly during a choppy consolidation, and averaging the two together hides that weakness. If your platform supports walk-forward testing, use it. It's a more realistic check than a single static backtest, since it re-optimizes settings on a rolling basis the way you'd actually trade.
Common Mistakes Traders Make With ATR Stops
The most frequent error is setting the ATR multiplier once and never revisiting it, even as the traded instrument's volatility regime shifts.
A second mistake is failing to adjust position size when the stop distance changes. Traders often set their contract count once at the start of a strategy and never recalculate it, meaning a wider ATR reading silently increases dollar risk per trade without anyone noticing until a loss makes the mismatch obvious.
Manually managing ATR-based trailing stops across several accounts is a third, underappreciated pitfall. It's tedious, and tedious tasks are where transcription errors and missed updates creep in, particularly during fast markets when every account needs the same adjustment within seconds of each other.
Ignoring scheduled news events is another common gap. An ATR calculated from the prior 14 quiet sessions doesn't reflect the volatility that's about to arrive with a jobs report or an OPEC decision, and traders who don't manually widen their stop or reduce size ahead of these events get stopped out at exactly the wrong moment.
Finally, some traders confuse a wider stop with a safer trade. It just relocates that risk from "frequent small losses" to "occasional large ones," and without adjusting contract size to match, the total dollar exposure can end up larger, not smaller.
What Matters Most When Applying ATR Stops to Futures
The technical mechanics of an ATR trailing stop are well documented and not particularly controversial. Where most guides fall short is treating the multiplier choice as an isolated decision, disconnected from position sizing and account management. That disconnect is where real trading losses happen, not in the ATR formula itself.
It isn't. The more consequential decision is whether you recalculate contract size every time your stop distance changes, and whether your risk management holds up when you're running the same logic across multiple accounts simultaneously rather than one.
Readers coming from a single-account background often underestimate how much operational risk creeps in the moment they scale to two or three accounts. A manually adjusted trailing stop is manageable on one account. It becomes a liability across several, particularly during the fast-moving minutes around scheduled news. Prioritize getting the sizing math automatic and consistent before spending more time optimizing the multiplier itself. The multiplier is a tuning parameter. Consistent execution is the foundation everything else depends on.
Automate ATR Stops Across Every Tradovate Account
Running a well-calibrated ATR trailing stop on one account is manageable by hand. Running the identical logic across several Tradovate accounts, in sync, during a fast market, is where manual execution breaks down. SafeFly mirrors trades from a lead account to every linked account automatically, applying a broker-side protective stop to each position the moment it opens, so your ATR-based exit holds even if your connection drops mid-session.
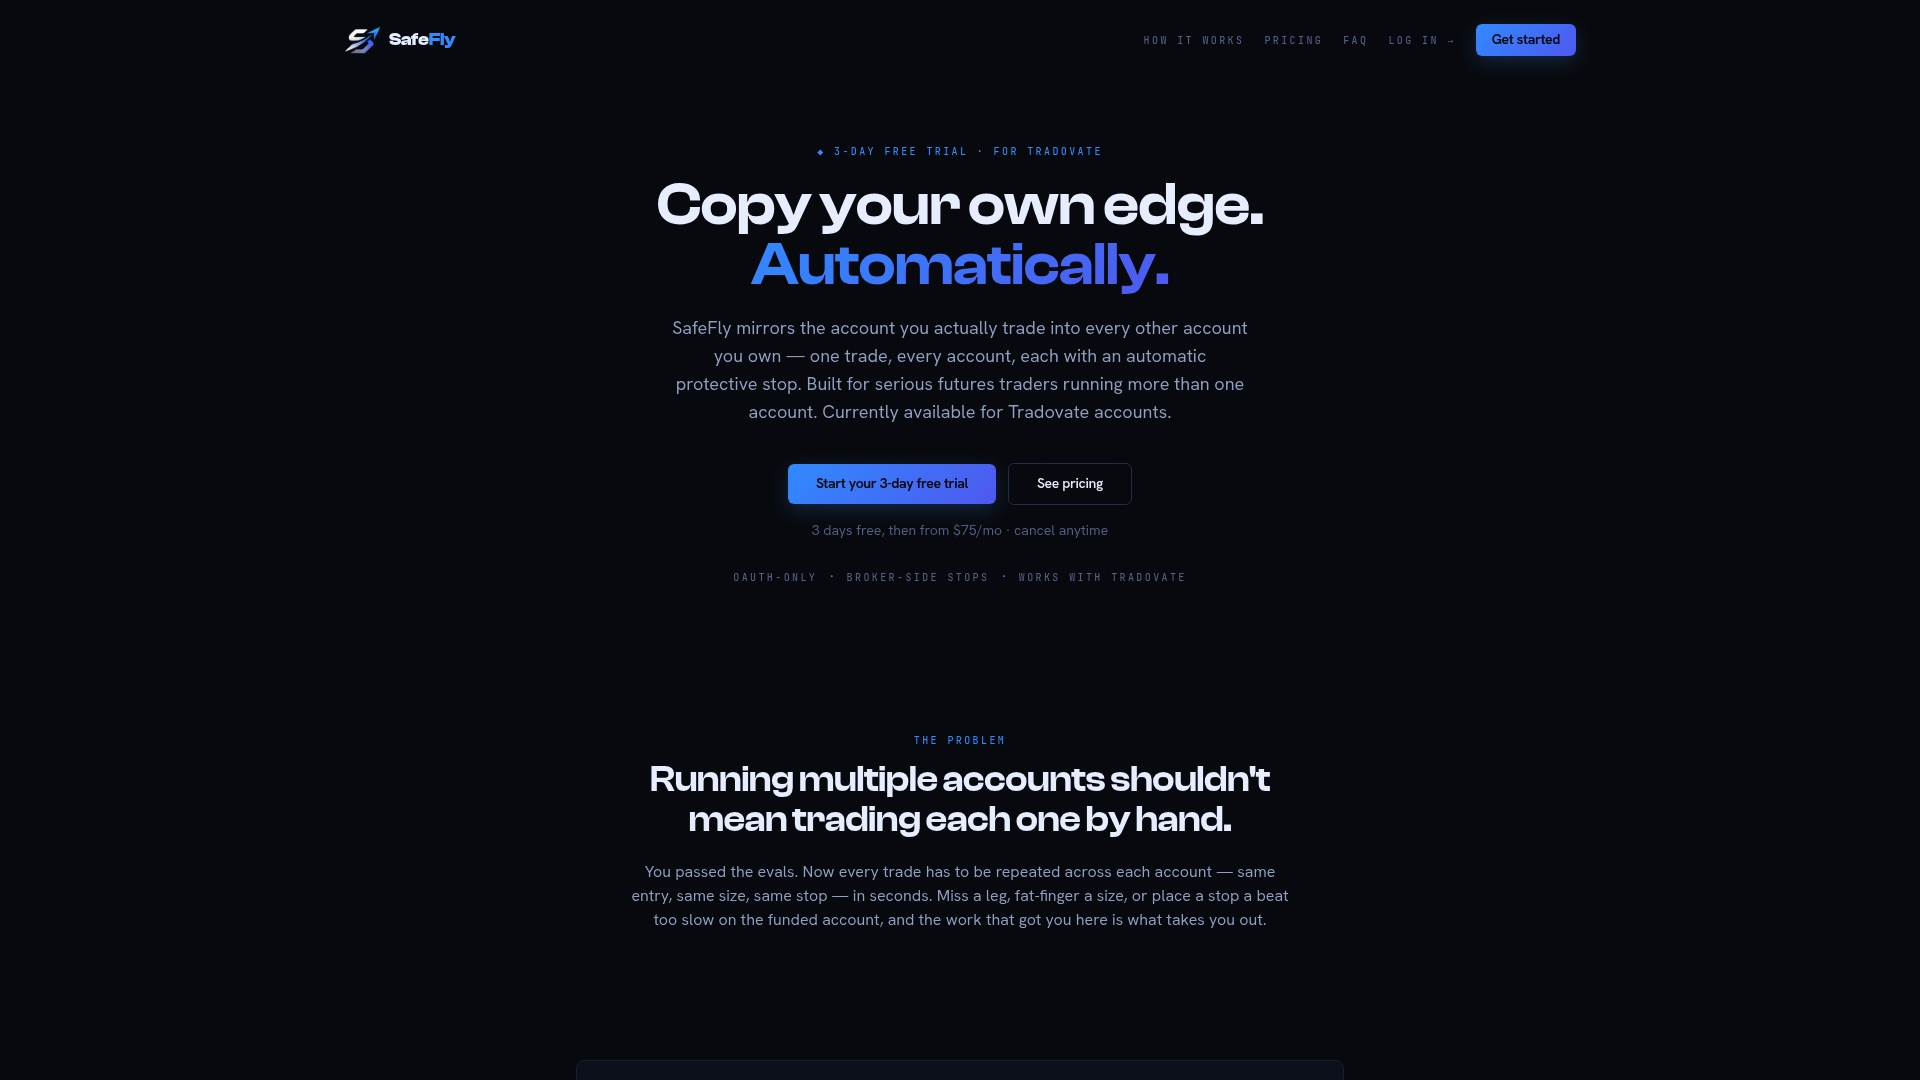
The platform connects through secure OAuth rather than shared credentials, and it layers in daily profit and loss lockouts so a single volatile session can't undo weeks of disciplined risk management. Every trade generates analytics you can review afterward, including how your stop placement performed relative to the ATR settings you chose. If you're already calculating ATR stops by hand across multiple accounts, see how the mechanics work on the SafeFly product page and compare subscription tiers on the pricing page before your next session.
Frequently Asked Questions
What is a good ATR multiplier for futures day trading?
How does an ATR trailing stop differ from a fixed stop loss? A fixed stop loss sets one static price and never adjusts to changing volatility. An ATR trailing stop recalculates the distance based on current market conditions and moves only in the direction that favors your open position.
Can I use ATR stops on multiple futures accounts at once? Yes, though manually applying the same ATR-adjusted stop across several accounts increases the chance of error. Automation tools like SafeFly mirror the trade and its protective stop across linked accounts simultaneously.
Does ATR stop placement work in sideways markets? ATR stops generally underperform in tight, range-bound conditions, where price oscillates without a clear trend and even a properly sized stop gets triggered repeatedly. They perform best in trending or swing conditions.
How often should I recalculate my ATR value? Most platforms recalculate ATR automatically on every new bar close. Review your multiplier and resulting position size at least weekly, and always before scheduled high-impact news events.
Sources
- ATR Trailing Stops — StockCharts ChartSchool
- How to Calculate Stop Loss Placement Using the Average True Range (ATR) - TradingToBeRich
- ATR: How the Average True Range Sets Stops and Sizes — KenMacro
- ATR stop loss calculator and multiplier comparisons — The Planet Indicator