

The Kelly Criterion identifies the growth-optimal fraction of capital to risk on a trade, but full Kelly is rarely usable in leveraged futures markets. The formula, developed by John Kelly in 1956 as f* = (bp - q) / b, maximizes long-term geometric growth, not short-term comfort. For futures traders working with leverage and margin, the practical move is to start at quarter-to-half Kelly and layer in volatility-normalized sizing on top of it.
That single adjustment separates traders who survive drawdowns from those who get liquidated during them. Full Kelly assumes you can stomach wealth swings that, in a leveraged futures account, translate into margin calls and forced exits long before the math catches up.
Before running any calculation, flag these three risk factors:
- Leverage magnifies errors. A small misestimate in your win rate or payoff ratio produces a wildly different position size than intended.
- Drawdown depth is often ignored. Full Kelly can produce 50%+ peak-to-trough equity swings even with a real edge.
- Margin mechanics don't wait. Mark-to-market losses can trigger a call before your "theoretical" edge has time to play out.
Key Takeaways
Fractional Kelly, sized down for futures leverage and paired with volatility-normalized position sizing, delivers most of Kelly's growth benefit while keeping drawdowns survivable.
| Point | Details |
|---|---|
| Start conservative | Use quarter to half Kelly as your working fraction, never full Kelly, in leveraged futures accounts. |
| Require sufficient data | Wait for at least 100 consistent trades before trusting a Kelly estimate; use fixed-fraction sizing until then. |
| Convert fraction to contracts carefully | Calculate dollar risk per contract from tick value and stop distance, then round the contract count down. |
| Layer in volatility sizing | Use fractional Kelly as a ceiling and ATR-based sizing underneath it to adapt to changing market conditions. |
| Watch for input sensitivity | Small errors in win rate or payoff ratio can swing recommended sizing by 50% or more, so buffer conservatively. |
Table of Contents
- What Is the Kelly Criterion in Futures Trading?
- Why Futures Markets Change the Kelly Math
- Calculating Kelly From Your Trade History: A Worked Example
- Fractional and Risk-Constrained Kelly: Why and How to Use Them
- A Practical Checklist for Sizing Trades With Kelly
- Combining Kelly With ATR-Based Position Sizing
- Common Pitfalls That Undermine Kelly-Based Sizing
- How SafeFly Supports Disciplined Kelly-Based Execution
- What the Kelly Criterion Really Demands of Futures Traders
- Sources
What Is the Kelly Criterion in Futures Trading?
The Kelly formula in its discrete, binary-outcome form is:
f = (bp - q) / b*
Here, p is your probability of winning, q is the probability of losing (1 - p), and b is the ratio of your average win to your average loss. The output, f*, is the fraction of your account to risk on the next trade to maximize long-run geometric growth.
Futures traders dealing with continuous returns rather than binary win/loss outcomes often use the continuous form instead:
f ≈ (μ - r) / σ²*
This version ties directly to the Sharpe ratio. μ is expected return, r is the risk-free rate, and σ² is variance. A strategy with a higher Sharpe ratio and lower volatility justifies a larger Kelly fraction, while a choppy, high-variance system gets penalized even if its average return looks attractive on paper.
The reason Kelly matters more than gut-feel sizing comes down to what it actually optimizes:
- It maximizes log-wealth, not arithmetic expectation. Betting the size that maximizes your expected return usually means betting too much, because a single catastrophic loss can wipe out years of gains. Kelly instead maximizes the expected logarithm of wealth, which accounts for the multiplicative nature of compounding returns.
- It penalizes variance automatically. Two strategies with identical average returns but different volatility profiles get different Kelly fractions. The continuous form's σ² term does this work directly.
- It produces a single number, not a range. That precision is useful, but it's also the formula's biggest trap. Treating f* as gospel rather than a starting point for adjustment is where most traders go wrong.
The math behind Kelly is well documented, but the intuition matters more for day-to-day trading than the derivation: bet more when your edge and consistency are both high, and bet less when either one softens.
Why Futures Markets Change the Kelly Math
Kelly was originally framed around unleveraged bets with clean win/loss outcomes, like a card game. Futures contracts introduce leverage, daily mark-to-market settlement, and margin requirements, all of which distort how a "pure" Kelly fraction translates into real risk.
Leverage doesn't change your edge, but it multiplies the dollar swings tied to any given percentage move. A Kelly calculation that looks conservative in percentage terms can still translate into a notional futures position large enough to blow through your maintenance margin on a single bad session, as futures-specific risk research points out.
Mark-to-market settlement adds another wrinkle. Unlike a stock position you can hold through a paper loss, futures accounts get debited daily. A string of adverse marks, even inside a statistically normal drawdown, can trigger a margin call and force liquidation before your edge has a chance to reassert itself.
Converting a Kelly fraction into an actual contract count requires a few extra steps:
- Calculate your dollar risk per contract using tick value multiplied by your stop distance.
- Divide your Kelly-derived dollar risk budget by that per-contract risk figure.
- Always round the resulting contract count down, never up.
- Cross-check the position against your available margin, not just your Kelly output.
Pro Tip: Run your contract-count math against both your Kelly fraction and your broker's margin requirement, then use whichever number is smaller. Kelly tells you the mathematically optimal size; margin tells you what the market will actually allow before it forces you out.
Calculating Kelly From Your Trade History: A Worked Example
Estimating p and b starts with a clean trade log, ideally recorded in R-multiples so wins and losses are comparable regardless of instrument or contract size. Your win rate (p) is simply the percentage of trades that closed positive. Your payoff ratio (b) is your average winning R divided by your average losing R, a method detailed in position-sizing guides for futures traders.
Here's a worked example using a hypothetical E-mini S&P trend-following system with 150 logged trades:
| Input | Value |
|---|---|
| Win rate (p) | a substantial portion |
| Loss rate (q) | the remaining portion |
| Average win | considerably more than average loss |
| Average loss | a standard unit of loss |
| Payoff ratio (b) | ratio of average win to average loss above one |
| Net edge after commissions/slippage | R per trade |
Running the discrete formula: f* = (bp - q) / b yields a calculated fraction of account equity to risk on the next trade at full Kelly, which practitioners typically adjust down for risk tolerance.
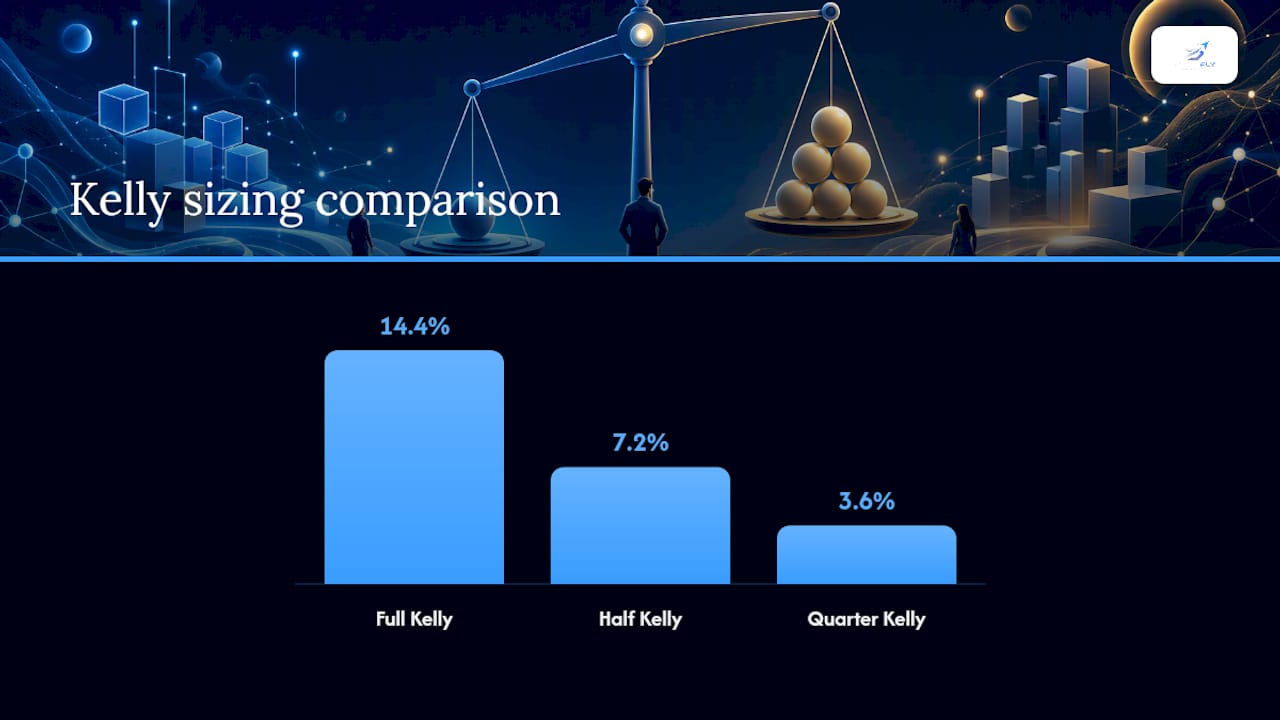
- Full Kelly (14.4%): Mathematically optimal for growth, but a rough patch of five consecutive losses would draw the account down more than most traders or risk managers would tolerate.
- Half Kelly (7.2%): Retains a substantial share of the growth rate while meaningfully cutting the depth and frequency of severe drawdowns, a tradeoff well documented in Kelly literature.
- Quarter Kelly (3.6%): The conservative starting point most systematic futures traders actually use, especially with fewer than a few hundred trades of data.
On a $50,000 account, quarter Kelly means risking $1,800 on the next trade. If your stop distance and tick value put per-contract risk at $600, that's three contracts, not the seven or eight a naive full-Kelly calculation might suggest.
Fractional and Risk-Constrained Kelly: Why and How to Use Them
Half Kelly and quarter Kelly aren't arbitrary discounts. They're responses to a mathematical reality: Kelly's growth curve is flat near the optimum but the drawdown curve steepens sharply as you approach full Kelly. Betting half the Kelly fraction typically sacrifices only a modest amount of long-run growth while cutting worst-case drawdown substantially, which is why most practitioner guidance treats half Kelly as the practical ceiling rather than the target.
Academic work has pushed this further with formal risk-constrained Kelly variants. Rather than picking an arbitrary fraction, these models add a drawdown probability constraint directly into the optimization, essentially asking "maximize growth, subject to keeping the probability of a 20% drawdown below X%." The math gets solved numerically, often through bisection algorithms for simplified two-outcome cases, an approach formalized by researchers Busseti et al.
Most quantitative funds treat full Kelly purely as a theoretical ceiling. In practice, they run at a quarter to half of that number and add explicit drawdown constraints on top.
For traders deciding where to start:
- Discretionary futures traders should lean toward quarter Kelly or lower, since manual execution introduces timing and emotional variance the formula doesn't account for.
- Systematic traders with automated execution and a longer track record can reasonably operate closer to half Kelly, provided their backtest sample is large and stable.
- Anyone with fewer than 100 trades should treat any Kelly output as directional at best, not a number to size real risk against.
A Practical Checklist for Sizing Trades With Kelly
Turning Kelly into a repeatable process, rather than a one-time spreadsheet exercise, requires a handful of operational rules.
- Require a minimum data set. Aim for at least 100 consistent, comparable trades before trusting a Kelly output, a threshold commonly cited in futures-focused sizing guides. Below that, use fixed-fraction sizing at 1% to 2% of equity instead.
- Run rolling-window Kelly, not a single static calculation. If your calculated f* swings widely from one 50-trade window to the next, your edge is unstable and the formula's precision is misleading you.
- Stress-test against fat tails. Backtest your sizing against your worst historical drawdown period, not just the average, since Kelly is highly sensitive to input error in exactly these tail scenarios.
- Cap your fraction and round contract counts down. Never round up to "get closer" to your target risk percentage.
- Build in a pause rule. If your rolling Kelly estimate turns negative or highly unstable, switch to conservative fixed-fraction sizing until the data stabilizes.
Let the data tell you when your edge is real, not your confidence.*
Combining Kelly With ATR-Based Position Sizing
A hybrid approach solves a problem pure Kelly can't: it doesn't adapt automatically to changing volatility regimes or contract rolls. The fix is to treat your fractional Kelly output as a ceiling, then size individual trades using ATR-normalized risk per contract underneath that ceiling.
The process looks like this in practice:
- Calculate your quarter or half Kelly percentage as the maximum capital you'll ever risk in a single trade.
- Calculate current dollar risk per contract using the instrument's Average True Range multiplied by tick value.
- Divide your Kelly-derived dollar ceiling by the ATR-based per-contract risk to get your contract count for that specific trade.
- Recalculate this every trade, since ATR shifts with volatility while your Kelly ceiling stays fixed until your next re-estimation.
This method, recommended in futures risk management research, produces a smoother equity curve than static Kelly sizing because it automatically scales down contract counts during high-volatility periods and scales up during calm ones, all without exceeding your growth-optimal risk budget.
Common Pitfalls That Undermine Kelly-Based Sizing
Kelly's precision is deceptive. The formula looks scientific, but it's only as good as the two inputs feeding it.
- Input sensitivity is the biggest risk. A small misestimate in win rate or payoff ratio can swing your recommended fraction by 50% or more, according to detailed sensitivity analysis of the formula's behavior.
- Fat tails distort the math badly. Strategies with negative skew, such as short-volatility or option-selling approaches, can show a strong historical edge right up until a single tail event erases years of gains. Kelly assumes your sample of past trades represents future risk, which breaks down exactly when it matters most.
- Commissions and slippage eat into your real edge. Always compute b and p using net returns after transaction costs, not gross trade results, or you'll systematically oversize.
- Drawdown tolerance is psychological, not just mathematical. Even a statistically "acceptable" 30% drawdown can push a trader into panic-driven decisions that break the strategy's edge entirely. Surviving the drawdown matters more than optimizing for it on paper.
How SafeFly Supports Disciplined Kelly-Based Execution
Calculating the right fraction is only half the problem. Executing it consistently across every trade, especially across multiple accounts, is where most sizing discipline actually breaks down.
SafeFly addresses this by automating trade replication and attaching broker-side protective stops to every mirrored position, cutting out the manual re-entry errors that quietly distort intended position sizes. Because stops are placed at the broker level rather than relying on a local terminal connection, protection holds even through a dropped connection, a gap most manual multi-account setups can't close.

Daily profit and loss lockouts add a second layer of protection, automatically halting trading once a preset daily loss threshold hits. That mechanism functions as an operational backstop to whatever fraction of Kelly you've chosen, catching the exact scenario where a string of losses compounds faster than your sizing model anticipated. Details on how these guardrails work are outlined on SafeFly's platform page.
The platform's trade analytics also feed directly back into the Kelly process itself:
- Track win rate and payoff ratio trends across rolling windows automatically instead of rebuilding spreadsheets by hand.
- Use AI-driven coaching feedback to spot when a strategy's edge is drifting before it shows up as a blown Kelly estimate.
- Apply consistent broker-side stops across every mirrored account, keeping your intended risk-per-trade uniform regardless of how many accounts you're running.
| Point | Details |
|---|---|
| Automation reduces sizing errors | Trade replication with broker-side stops keeps intended position sizes consistent across accounts. |
| Daily lockouts back up Kelly discipline | P&L limits halt trading before a losing streak exceeds your chosen risk fraction. |
| Analytics support re-estimation | Ongoing trade data tracking makes rolling Kelly recalculation practical rather than manual. |
Ready to enforce your sizing rules automatically instead of manually across every account? Review SafeFly's pricing plans and see how the platform's risk controls fit into your existing Kelly framework.
What the Kelly Criterion Really Demands of Futures Traders
The conventional advice on Kelly sizing treats it as a math problem: plug in your win rate and payoff ratio, get a number, size accordingly. That framing undersells what actually determines whether Kelly helps or hurts a futures trader.
The real constraint isn't the formula. It's whether your data is stable enough to trust and whether your operational execution can hold the line when a losing streak arrives exactly when your sizing model says it shouldn't. A trader running quarter Kelly with sloppy manual execution across three accounts is often worse off than one running half Kelly with automated stops and a daily lockout enforcing discipline.
Prioritize this: get your sample size right, size down further than feels necessary, and put mechanical guardrails around your execution before you worry about optimizing the fraction itself. Kelly rewards survivability first and growth second. Most blown accounts weren't undersized mathematically. They were oversized operationally.
— Arturo
This article is general information, not a substitute for advice from a qualified financial advisor. Consult a qualified financial professional about your own circumstances before acting on anything here.
Sources
- Kelly criterion — Wikipedia
- Kelly criterion — Corporate Finance Institute
- Futures Risk Management: Position Sizing, Drawdown Math, and the Kelly Criterion — Falco Insights
- The Risk-Constrained Kelly Criterion (Busseti et al.) — SCIRP
- Kelly Criterion position sizing — Quantified Strategies