

Maximum favorable excursion (MFE) measures the highest unrealized profit a trade reaches between entry and exit. The immediate takeaway: the gap between MFE and your actual exit price is profit left on the table, and tracking that gap systematically is how traders build evidence-based profit targets instead of guessing.
Key Takeaways
MFE converts raw trade history into concrete exit rules by measuring the gap between peak potential and actual capture, making it the most direct diagnostic tool for profit-target calibration.
| Point | Details |
|---|---|
| Compute MFE per trade | Use tick or 1-minute data; apply VWAP for multi-fill entries to get an accurate peak. |
| Build a survival curve | Plot the percentage of trades reaching each MFE level to identify T1 (70–80%) and T2 (25–35%) target zones. |
| Track capture ratio | Divide realized P&L by MFE; analyze over 200+ trades to detect systematic exit issues. |
| Audit giveback quarterly | Giveback = MFE minus realized profit; persistent large giveback signals exits are too early or stops too tight. |
| Automate scale-out rules | Encode MFE-derived targets as fixed order rules to reduce manual delays near intratrade peaks. |
Table of Contents
- What max favorable excursion measures and how it differs from MAE
- Exact formulas for MFE, MFE%, and multi-entry trades
- Worked examples: single trade, losing trade, and a scaling-in case
- How to use MFE to set profit targets and audit exits
- Incorporating MFE into backtests and trade analytics
- Common pitfalls that distort MFE calculations
- A step-by-step checklist to compute MFE from your trade log
- How SafeFly helps traders capture more of their available MFE
- An editorial perspective on MFE in a trader's weekly workflow
- Primary sources and further reading
- Sources
What max favorable excursion measures and how it differs from MAE
MFE quantifies the peak intratrade favorable price movement before a position closes. For a long trade, that is the highest price reached during the trade minus the entry price. For a short trade, it is the entry price minus the lowest price reached during the trade. MFE is a peak, not a realized figure. A trade can show a large MFE and still close at a loss.
Key distinctions to keep straight:
- MFE vs. MAE: Maximum Adverse Excursion (MAE) measures the worst unrealized drawdown during a trade. MFE measures the best unrealized gain. Both are intratrade metrics; neither equals realized P&L.
- MFE vs. realized P&L: MFE captures the peak potential. Realized P&L is what actually hits the account. The difference between the two is giveback.
- When MFE is measured: From the moment a position opens to the moment it closes. Any price movement after exit is irrelevant to MFE.
- Data granularity: MFE computed from daily bars will understate the true intraday peak. Tick data or 1-minute bars are the preferred source for day trading, where intrabar swings can be substantial.
Exact formulas for MFE, MFE%, and multi-entry trades
The formulas below are the standard implementations used across trade analytics platforms.
- Price-based MFE (long trade): MFE = Peak price during trade − Entry price
- Price-based MFE (short trade): MFE = Entry price − Lowest price during trade
- MFE% (long): MFE% = ((Peak price − Entry price) / Entry price) × 100
- MFE% (short): MFE% = ((Entry price − Lowest price) / Entry price) × 100
Converting to MFE% is the correct approach for cross-instrument comparison because a 10-point move means something different on a $50 stock versus a $500 futures contract.
Handling multiple entries (scaling in): When a trade has more than one fill, the entry price used in the MFE formula should be the volume-weighted average price (VWAP) of all fills. The VWAP formula is:
VWAP = Σ(Fill price × Fill quantity) / Σ(Fill quantity)
Using the first fill price instead of VWAP overstates MFE when subsequent fills are at worse prices, and understates it when they are at better prices. VWAP is the recommended standard.
Running-PnL variant: Some platforms record position-level MFE, which is the maximum interim profit for the full position in dollar terms, accounting for size. Others record price-level MFE, which is the maximum favorable price movement independent of position size. Both metrics are complementary; capturing both is preferable when analyzing strategies that scale or use partial exits.
Worked examples: single trade, losing trade, and a scaling-in case
The three examples below use a hypothetical E-mini S&P 500 futures contract where one point equals $50.
Example 1 is the baseline case. The trade peaked at 4,520, but the exit at 4,512 captured only 12 of the available 20 points.
Example 2 illustrates a diagnostic insight that surprises many traders: a trade can have a positive MFE yet close as a loss. The position reached 4,510 (MFE = 10 points), reversed, and exited at 4,492 for a loss of 8 points. The MFE was real; the exit was not.
Example 3 uses two fills: 2 contracts at 4,500 and 1 contract at 4,504. VWAP = ((4,500 × 2) + (4,504 × 1)) / 3 = 4,501.33. MFE = 4,522 − 4,501.33 = 20.67 points. On a 3-contract position that is $3,100.50 peak potential.
Pro Tip: Always verify that the peak price timestamp falls within the trade's open window. An intraday high recorded before entry or after exit does not count as MFE. Exchange timestamps and broker timestamps can differ by seconds; standardize to one timezone and one source before running calculations.
How to use MFE to set profit targets and audit exits
The capture ratio is the primary diagnostic tool: Capture Ratio = Realized P&L / MFE. Consistent large giveback, defined as MFE minus realized profit, indicates exits are too early or trailing stops are too tight.
Practical applications:
- Target-setting with survival curves: Plot the percentage of trades that reach each MFE level to build a survival curve. Set T1 (first scale-out target) at the MFE percentile where 70–80% of trades historically arrive. Set T2 (runner target) at the level where 25–35% of trades arrive. These percentiles give targets with a known historical hit rate.
- Trailing stop calibration: If the average giveback across 200+ trades is consistently 40% of MFE, a trailing stop set to lock in 60% of peak gain is a data-derived starting point, not an arbitrary number.
- Position sizing: Trades with historically wide MFE distributions may warrant smaller initial size and a scale-out plan rather than a fixed single target.
- Exit audits: Sort trades by giveback descending. The top 10% of trades by giveback are the cases where exit rules failed most severely. Review those trade-by-trade for pattern.
Fills at the precise peak are rare. A conservative adjustment of 2–5 ticks or points below the target level accounts for fill realism and avoids chasing a price that the market may touch for only one tick.*
Incorporating MFE into backtests and trade analytics
A single MFE figure from one trade is not actionable. The signal comes from aggregating across a meaningful sample.
| Metric | What it reveals | Recommended threshold |
|---|---|---|
| Mean MFE | Average peak potential per trade | Baseline for target-setting |
| Median MFE | Central tendency, less sensitive to outliers | Use alongside mean |
| 70th percentile MFE | T1 target zone | 70–80% of trades reach this level |
| 25th–35th percentile MFE | T2 runner target zone | Lower hit rate, higher reward |
| Capture ratio (mean) | Overall exit efficiency | Track over 200+ trades |
| Giveback (mean) | Average profit surrendered after peak | Diagnose trailing stop tightness |
Distribution shape carries its own information. A bimodal MFE distribution, where trades cluster at two distinct peak levels, suggests the strategy has two behavioral regimes. A single fixed target will underserve one of them. Two-tier scale-outs map more naturally to that structure.
For charting, a survival curve plots MFE level on the x-axis against the percentage of trades that reached at least that level on the y-axis. The curve drops steeply where most trades reverse. That inflection point is where T1 belongs. A histogram of MFE values shows the full distribution and makes outliers visible.
Use tick or 1-minute intraday data when computing MFE for backtests. Daily or 5-minute bars compress intrabar swings and systematically undercount the true peak, which biases survival curves toward lower MFE values and produces targets that are too conservative.
Common pitfalls that distort MFE calculations
Getting the formula right is only half the problem. Data and implementation issues are where MFE analysis most often breaks down.
- Low-resolution bars: A 5-minute bar's high may not capture the actual tick-level peak. Day traders using 5-minute data for MFE will consistently understate excursion.
- Misaligned timestamps: Exchange timestamps, broker timestamps, and data-feed timestamps can diverge. A peak recorded one second before the official entry time will incorrectly exclude a valid MFE candidate. Standardize all timestamps to UTC or exchange local time before processing.
- Exchange vs. broker price differences: Bid/ask spread means the price a data feed records as the high may not be the price at which a limit order would have filled. Use the same price series (bid, ask, or mid) consistently.
- Fees and slippage: MFE computed on gross price movement overstates net-available profit. Record fees and slippage per trade and compute a net-MFE figure alongside the gross figure for realistic target-setting.
- Partial fills and position-level confusion: A partial fill changes the effective entry price. Using the first fill price when VWAP is the correct basis introduces systematic error in MFE% calculations.
- Overfitting to historical peaks: Targets derived from MFE distributions reflect past market conditions. Walk-forward validation, testing targets on out-of-sample data, is necessary before treating any MFE-derived rule as stable.
A step-by-step checklist to compute MFE from your trade log
- Export the trade log. Pull entry time, entry price(s), exit time, exit price, fill quantities, realized P&L, and fees for each trade.
- Unify timestamps. Convert all timestamps to a single timezone (UTC is standard). Confirm entry and exit times align with the price data source.
- Select the price series. Use tick data or 1-minute bars. Record the intratrade high (for longs) or intratrade low (for shorts) with its timestamp for each trade.
- Compute VWAP for multi-fill trades. Apply the VWAP formula to all fills before computing MFE.
- Calculate per-trade MFE and MFE%. Apply the appropriate formula for long or short direction.
- Compute giveback. Giveback = MFE − Realized P&L (gross). Record both gross and net versions.
- Aggregate statistics. Calculate mean, median, and key percentiles (70th, 80th, 25th) across the full sample. A minimum of 200 trades is recommended for stable capture-ratio analysis.
- Run a capture-ratio audit. Sort by capture ratio ascending. Identify the bottom quartile and review those exits for systematic patterns.
Fields to save per trade: entry time, entry price(s), VWAP (if applicable), intratrade high/low with timestamps, exit time, exit price, realized P&L (gross and net), fees, and a fill-realism note (market vs. limit, partial fill flag).
A simple SQL approach loops through the intraday price series for each trade's open window, filters rows where the timestamp falls between entry time and exit time, and takes MAX(high) for longs or MIN(low) for shorts. That single aggregation per trade produces the MFE price level directly.

How SafeFly helps traders capture more of their available MFE
Knowing your MFE is one step. Executing against it consistently is another. Manual execution introduces delays at precisely the moments when speed matters most: scaling out near a peak, placing a protective stop before a reversal, or replicating a trade across multiple accounts simultaneously.
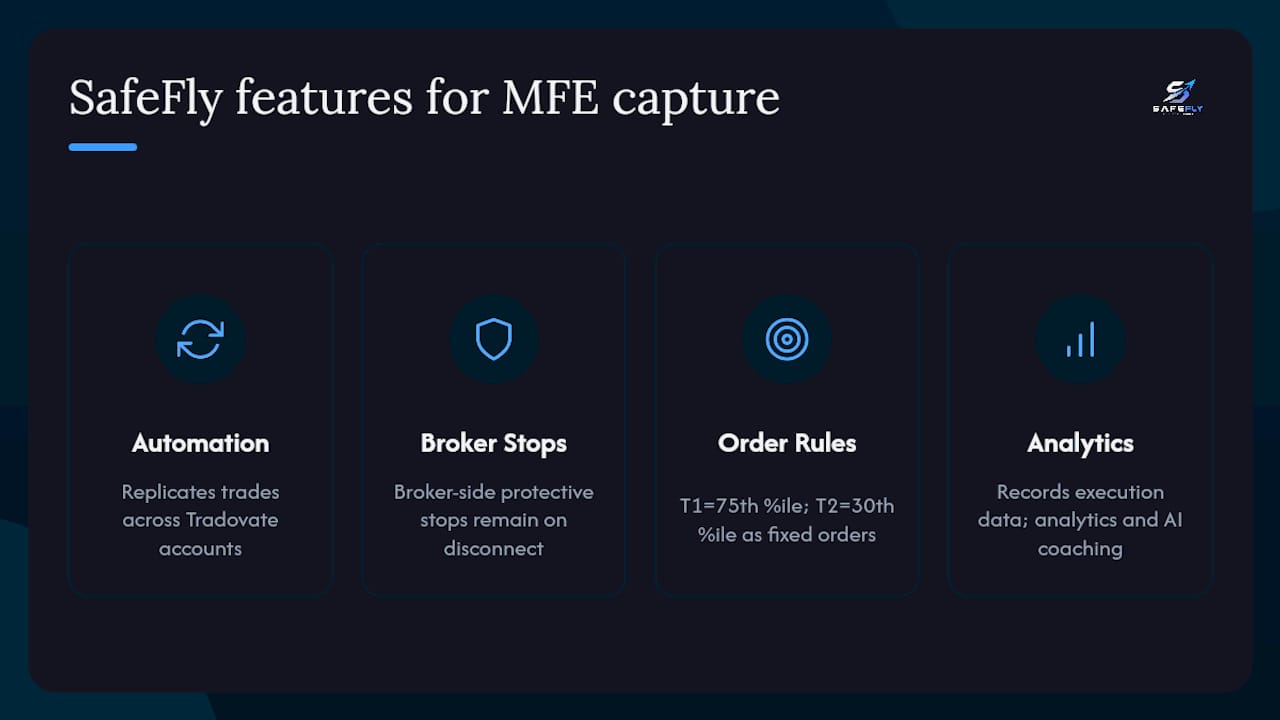
SafeFly automates trade replication across multiple Tradovate accounts and places broker-side protective stops on every mirrored position. Broker-side stops remain active even if the trader's connection drops, which addresses one of the most common causes of missed fills near intratrade peaks. The platform connects via secure OAuth, eliminating credential-sharing risk across accounts.
For MFE-derived exit rules, SafeFly's automation allows traders to encode scale-out percentages and trailing stop parameters directly into the execution workflow. A T1 target at the 75th-percentile MFE level and a T2 runner at the 30th-percentile level can be set as fixed order rules rather than manual decisions made under pressure. Daily P&L lockouts add a hard floor that prevents a single session from erasing gains accumulated over a period.
SafeFly also records detailed execution data and provides trade analytics alongside AI coaching, which supports the capture-ratio and MFE survival-curve analysis described throughout this article.
Pro Tip: Map your MFE-derived T1 and T2 levels into your automated order rules as fixed point or tick offsets from entry. Review and recalibrate those offsets quarterly as market conditions shift. Traders should validate all MFE-derived rules against their own backtests before deploying them in live accounts.
This section reflects SafeFly's platform features as documented. Traders should conduct independent backtesting to validate any MFE-based exit rules before applying them in live trading.

An editorial perspective on MFE in a trader's weekly workflow
Most traders who start tracking MFE go through the same sequence. That instinct is usually wrong. A tighter trailing stop reduces giveback on winning trades but also stops out trades that would have continued higher. The survival curve is what resolves that tension: it shows exactly how many trades would have been cut short at each trailing level versus how many would have benefited.
The habit that produces the most durable improvement is a quarterly capture-ratio audit, not a daily one. Daily noise obscures the signal. Quarterly aggregation across a meaningful sample reveals whether exit rules are structurally sound or structurally broken. Run the audit, identify the bottom quartile of trades by capture ratio, and ask one question: was the exit rule followed, or was it overridden manually? The answer almost always points to the real problem.
Primary sources and further reading
- Max Favorable Excursion: How Much Profit You Leave Behind — TradingMetrics documentation covering MFE definition, MFE%, VWAP handling, and capture ratio.
- Maximum Favorable Excursion (MFE): The Data Behind Your Profit Target Placement — NexusFi Academy guide on survival curves, T1/T2 target selection, and data-granularity recommendations.
- What Is MFE? Maximum Favorable Excursion — TradeReview article with worked examples, capture ratio definition, and sample-size guidance.
- MFE and MAE Calculations — Tradervue Help Center explanation of position-level vs. price-level MFE and reporting nuances.
- Maximum favorable excursion (MFE) — forex.pm summary of the giveback concept and exit-calibration diagnostics.
- How it works · SafeFly — SafeFly platform documentation covering trade automation, broker-side stops, OAuth integration, and analytics features.
This article is general information, not a substitute for advice from a qualified financial advisor. Consult a qualified financial professional about your own circumstances before acting on anything here.
Sources
- Max Favorable Excursion: How Much Profit You Leave Behind
- What Is MFE? Maximum Favorable Excursion | TradeReview
- MFE and MAE Calculations - Tradervue - Help Center