

Trade expectancy is calculated as (Win Rate × Average Win) − (Loss Rate × Average Loss), and the result tells you the average dollar amount you make or lose per trade over time. A positive number means the strategy is mathematically sound and should generate profit across a large enough sample. A negative number means the system loses money regardless of how confident it feels in the moment, and expectancy is the single figure that separates a repeatable edge from a string of lucky trades.
TL;DR:
- Even a low-win-rate strategy can be profitable if it maintains a positive expectancy, such as a 35% win rate with a 3:1 payoff ratio.
- A high-win-rate system may still lose money if its average loss exceeds the average win, as exemplified by a 70% win rate with a 3:1 payoff ratio.
- Real expectancy depends heavily on net figures after costs; neglecting commissions and slippage often overstates a system's profitability.
- Expectancy should be recalculated after every trade using a rolling 50-trade window to adapt to market shifts and avoid outdated results.
- Improving expectancy involves cutting losses faster, letting winners run, and ensuring execution quality rather than simply increasing trade frequency or adding setups.
Table of Contents
- What Is the Trade Expectancy Formula, Exactly?
- Worked Numeric Examples: Profitable and Unprofitable Strategies
- Normalizing Expectancy: R-Multiples, Payoff Ratio, and a Payoff Matrix
- Measuring Real Expectancy From Your Trade Journal
- How to Improve Your Trade Expectancy
- Turning Expectancy Into Position Sizing Decisions
- Common Mistakes That Distort Expectancy Numbers
- Key Takeaways and Action Checklist
- Why Reliable Execution Is the Missing Half of the Expectancy Conversation
- Protect Your Edge With Execution That Matches Your Math
- Calculators and Guides Worth Bookmarking
- Sources
What Is the Trade Expectancy Formula, Exactly?
The canonical trade expectancy formula is:
E = (Win Rate × Average Win) − (Loss Rate × Average Loss)
Each input has a specific job, and skipping any one of them produces a number you can't trust:
- Win Rate — the percentage of trades that closed profitably, expressed as a decimal (60% becomes 0.60).
- Loss Rate — simply 1 minus the win rate, assuming no trades close at breakeven.
- Average Win — the mean dollar profit across winning trades, calculated after commissions and slippage.
- Average Loss — the mean dollar loss across losing trades, also net of costs.
Using pre-cost numbers is the most common error traders make when they run this calculation for the first time. A strategy that looks profitable on gross P&L can flip negative once real fees are subtracted, which is why every serious trading journal should track net figures from the start.
There's also an R-multiple variant, which reframes the same formula in terms of risk units instead of dollars:
E(R) = (Win Rate × Avg Win in R) − (Loss Rate × Avg Loss in R)
An "R" is simply your initial risk per trade. If you risk $200 on a setup and it wins $600, that's a 3R winner. This version matters more than the dollar version for one practical reason: it lets you compare a strategy you traded with a $5,000 account against one you traded with a $50,000 account, because both get normalized to the same unit of risk.
Worked Numeric Examples: Profitable and Unprofitable Strategies
Numbers make expectancy real in a way percentages alone never do. Here are two contrasting scenarios that show exactly how the math plays out.
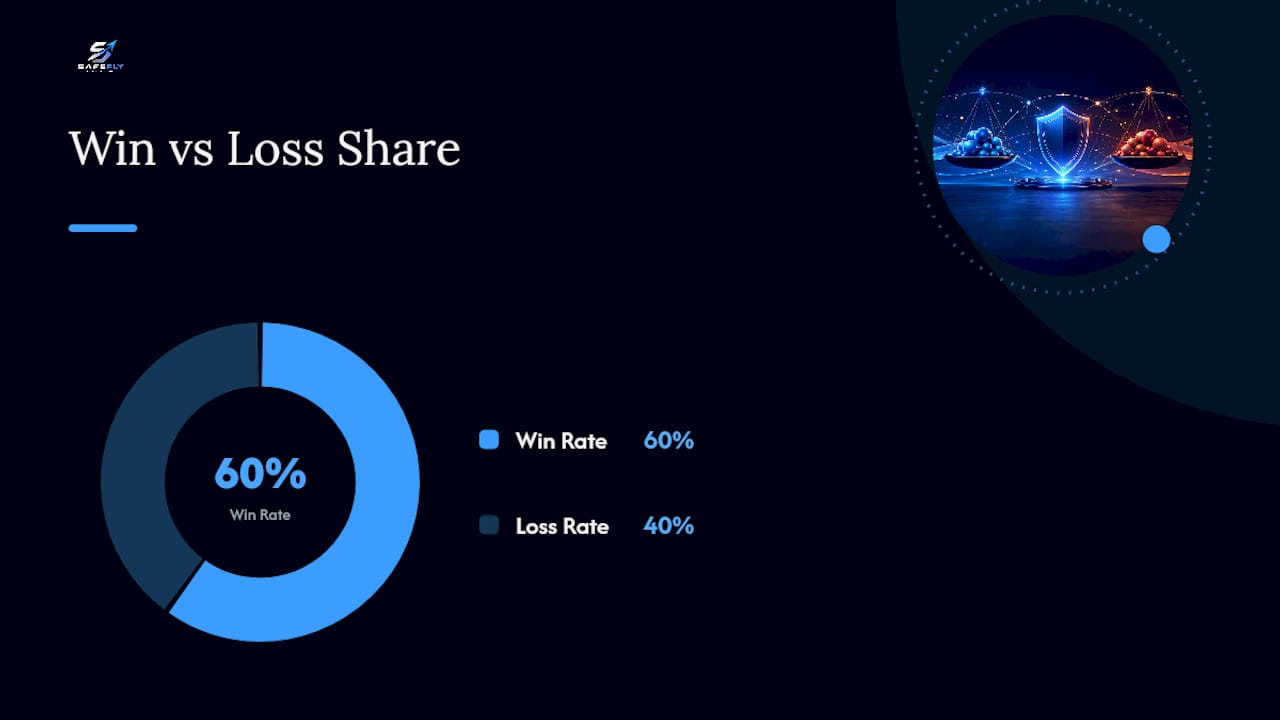
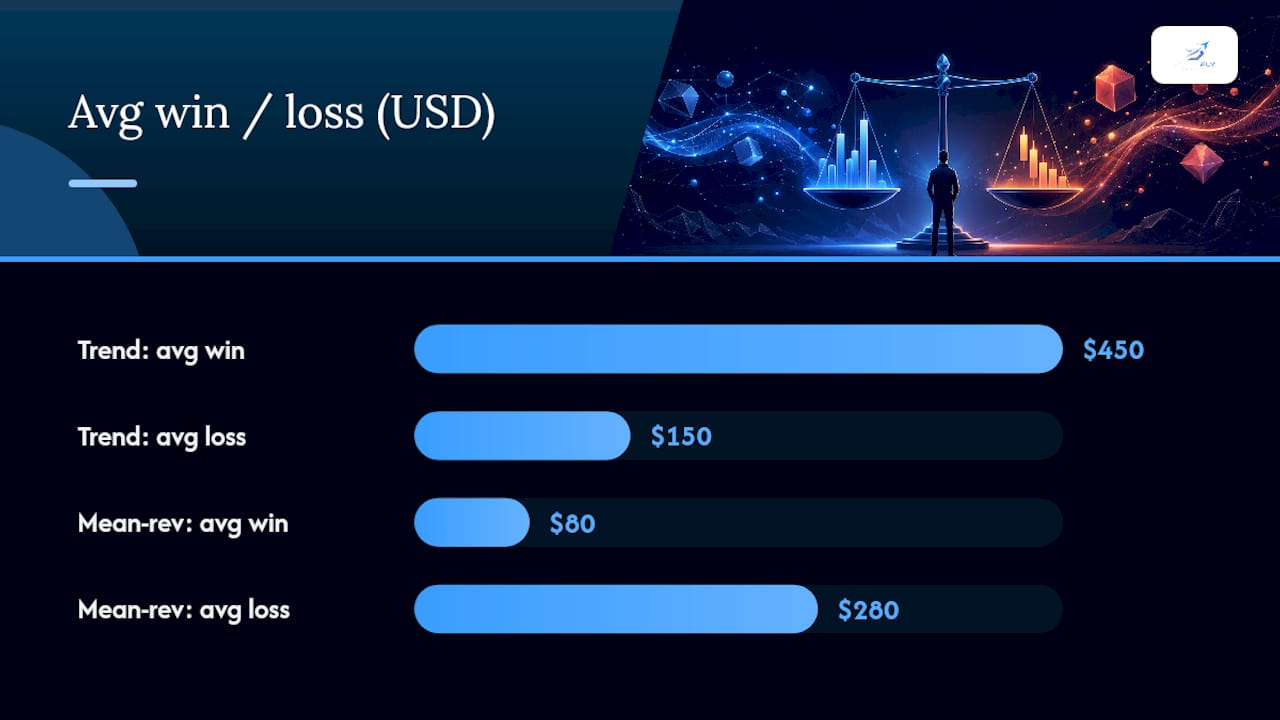
- A low-win-rate strategy that's still profitable. Say a trend-following system wins only 35% of the time. Average win is $450, average loss is $150. Expectancy is (0.35 × $450) − (0.65 × $150) = $157.50 − $97.50 = $60 per trade. Despite losing on nearly two out of three trades, the strategy is solidly profitable because winners run far longer than losers.
- A high-win-rate strategy that quietly bleeds money. A mean-reversion system wins 70% of the time, which sounds excellent on paper. But average win is only $80 while average loss is $280, because the strategy occasionally holds a loser too long. Expectancy is (0.70 × $80) − (0.30 × $280) = $56 − $84 = negative $28 per trade. That trader will lose money steadily even while "winning" most of the time.
Statistic to remember: most consistently profitable retail traders operate with modest per-trade expectancy, often somewhere in the $5 to $50 range depending on style and instrument. The edge itself doesn't need to be dramatic. It needs to be positive and repeatable across volume.
Converting these to R-multiples clarifies things further. In the first example, if $150 represents 1R, the average win is 3R and the average loss is 1R. Expectancy in R is (0.35 × 3) − (0.65 × 1) = 1.05 − 0.65 = 0.40R per trade. Risking $200 per trade on that system, you'd expect roughly $80 in profit per trade on average ($200 × 0.40R). That single number, 0.40R, is portable across any account size, which is exactly why professional system developers report results in R rather than raw dollars.
Normalizing Expectancy: R-Multiples, Payoff Ratio, and a Payoff Matrix
Payoff ratio is average win divided by average loss, and it's the second half of the expectancy equation that win rate alone can never capture. A 3:1 payoff ratio means your winners are three times the size of your losers on average.
Once you know your payoff ratio, you can calculate the exact win rate needed just to break even, using the breakeven curve:
p = 1 / (1 + R)*
where R is the payoff ratio. Anything above that, and you're in positive expectancy territory.
The table below shows breakeven win rates across common payoff ratios, along with the expectancy generated at a win rate 10 points above breakeven, normalized to average loss size (1R = average loss):
Read the table by picking your realistic payoff ratio first, then checking whether your actual win rate clears the breakeven column with room to spare. A system sitting right on its breakeven win rate is fragile. One that clears it by 10 points or more has a margin that survives a rough stretch.
Measuring Real Expectancy From Your Trade Journal
Expectancy is only as good as the data behind it, and that means building a journal that captures the right fields from day one.
- Log every trade with gross P/L, commissions, and estimated slippage separately, then compute a net result. Never rely on gross numbers.
- Calculate average win and average loss from the net figures only. This is where including costs most often changes the sign of your expectancy.
- Use a rolling 50-trade window rather than your all-time average. Markets shift, and a strategy's edge from 18 months ago tells you little about whether it's still working now.
- Recalculate expectancy after every closed trade within that window, watching for drift rather than waiting for a quarterly review.
Costs matter more than most traders assume. Gross expectancy looks like (0.55 × $120) − (0.45 × $100) = $66 − $45 = $21 per trade. Now subtract $8 in round-trip commissions and slippage from every trade, win or lose. On a high-frequency system, that gap can erase the edge entirely.
How to Improve Your Trade Expectancy
Raising expectancy usually means fixing one of two variables: average loss size or average win size. Chasing more trades before fixing either one just multiplies whatever edge, or lack of one, you already have.
- Cut losses faster. Set a hard stop at a predefined R multiple and honor it mechanically; the moment you start "giving trades room," average loss size creeps up and expectancy falls.
- Let winners run. Use a trailing stop or scale-out approach instead of a fixed profit target, and consider adding to a winning position (pyramiding) only after it has moved a full 1R in your favor.
- Raise your entry bar. Instead of adding more setups to trade more often, tighten the criteria on the setups you already take. Fewer, cleaner entries usually beat more, noisier ones.
- Protect execution quality. Slippage and partial fills erode real-world expectancy even when your backtest numbers look clean.
Pro Tip: Before adding a new setup or indicator to your system, ask whether it improves your payoff ratio, your win rate, or neither. If the answer is neither, it's noise, not edge.
Turning Expectancy Into Position Sizing Decisions
Expectancy in R tells you exactly what to expect from risking a given dollar amount per trade. If your rolling expectancy is 0.30R and you risk $300 per trade, your expected value per trade is $90. That number should directly drive how much you're willing to put at risk, not gut feel.
- Near breakeven (E between 0.00 and 0.10R): cut position size in half until the edge proves stable across more trades.
- Stable positive expectancy (E between 0.10 and 0.25R): trade your normal, predetermined size.
- Strong and stable (E above 0.25R): consider conservative pyramiding on winners, but only if drawdown has stayed within your normal range.
- Negative rolling expectancy: pause the system entirely rather than trading through it and hoping it recovers.
This rolling-window guardrail approach keeps sizing decisions tied to actual, current performance instead of an outdated backtest or last year's results.
Common Mistakes That Distort Expectancy Numbers
- Trusting small samples. Ten or twenty trades can produce a wildly misleading expectancy figure; wait for at least 50 trades before drawing conclusions.
- Ignoring worst-case drawdown. A positive average doesn't guarantee survivability if one outlier loss is large enough to wipe out weeks of gains.
- Overlooking execution mechanics. Order type selection matters in futures markets, since limit orders, market-limit orders, and protection price ranges all change how much slippage actually shows up in your fills.
- Averaging across regimes. Blending a trending-market sample with a choppy-market sample can hide the fact that your edge only exists in one condition.
Key Takeaways and Action Checklist
- Calculate expectancy using net, post-cost numbers, and refresh it on a rolling 50-trade basis rather than an all-time average.
- Express results in R-multiples so you can compare strategies fairly across different account sizes.
- Check your win rate against the breakeven curve (p* = 1 / (1 + payoff ratio)) before assuming a system is safe to scale.
- Improve payoff ratio before chasing higher win rate. It's usually the faster lever to pull.
One number worth remembering: a marginally positive expectancy can be erased by commissions and slippage alone, which is exactly why execution quality belongs on the same priority list as strategy design.
Why Reliable Execution Is the Missing Half of the Expectancy Conversation
Most discussions about trade expectancy stop at the spreadsheet. The formula assumes every trade gets filled the way you intended, every stop gets honored, and every account behaves identically. Live futures trading rarely cooperates with that assumption, especially for traders running the same system across several Tradovate accounts by hand.
Manually replicating trades across multiple accounts introduces exactly the kind of execution drag that quietly erodes a positive edge: a missed fill on one account, a stop that never got placed after a disconnection, a fat-finger entry under time pressure. None of that shows up in a backtest, but all of it shows up in your realized expectancy. Traders managing multiple funded or prop accounts learn quickly that the math and the mechanics are two separate problems, and solving only one leaves money on the table.
Automated trade mirroring with broker-side protective stops closes that gap directly. When a stop lives at the broker level rather than in your platform, it survives a dropped connection or a frozen screen, which matters more than most traders realize until the one time it doesn't happen.
— Arturo
Protect Your Edge With Execution That Matches Your Math
A positive expectancy on paper only pays out if every account executes the trade the same way, every time. That's the part manual multi-account trading breaks most often, and it's exactly where SafeFly fits in.

SafeFly mirrors trades from a lead account across your other Tradovate accounts automatically, so the edge you calculated in your journal is the edge that actually shows up in your fills. Specific features built around protecting that expectancy include:
- Automated trade replication across multiple accounts, removing manual entry lag and human error
- Broker-side protective stops that stay active even if your connection drops
- Daily profit and loss lockouts to enforce your own risk guardrails automatically
- Detailed trade analytics and AI coaching to track your rolling expectancy over time
Secure OAuth integration keeps account access locked down without sacrificing speed. If you're managing more than one Tradovate account and want your realized expectancy to match your calculated expectancy, see how SafeFly works and start your trial.
Calculators and Guides Worth Bookmarking
For readers who want to run their own numbers, a trade expectancy calculator gives instant results and projects monthly and annual returns based on trades per month. For the deeper mechanics behind the formula itself, the expectancy guide from Traders Second Brain and the payoff matrix breakdown from Finaur both walk through the math with additional worked scenarios worth comparing against your own trade log.
Sources
- Trading Expectancy Formula: Calculate Your Edge (2026)
- Why Expectancy Beats Win Rate | Pro Trading Journal
- Trade System Expectancy Formula: Win Rate and More
- Trade Expectancy Calculator - Measure Your Edge
- Order Types for Futures and Options — CME Group