

An iceberg order splits a large futures position into a small visible display quantity and a much larger hidden reserve that reloads automatically as fills occur. Traders who can read the signs of an iceberg gain a real edge: hidden size can absorb aggressive flow at a price level, stall a breakout, or quietly build a position without moving the market. Watching time and sales, DOM reloads, and footprint charts for repeated fills at one price is the fastest way to catch one in action.
TL;DR:
- Native iceberg orders typically reveal only 5% to 20% of their total size, meaning significant hidden liquidity can be present in liquid futures markets.
- Detecting icebergs relies on spotting repeated fills at the same price, trading volume exceeding visible depth by three or more times, and price absorption without movement.
- Using tools like time and sales, DOM, heatmaps, and footprint charts enhances detection accuracy, but false positives are common without backtested, multi-filter heuristics.
- Trading strategies include trading with absorption signals, waiting for reload weakening or exhaustion, and confirming with delta and volume profile for greater confidence.
- Operational safeguards such as protective stops at the broker level and automated multi-account management reduce risks associated with iceberg trading, especially in thin or volatile markets.
Table of Contents
- What Are Iceberg Orders in Futures Trading?
- Which Exchanges Support Native Iceberg Orders?
- How Do You Detect Iceberg Orders on the Tape?
- Trading Strategies for Iceberg Orders in Futures
- Execution Risks and a Pre-Trade Checklist
- Operational Controls for Multi-Account Iceberg Execution
- What Iceberg Literacy Actually Changes for a Trader
- An Automation Layer for Traders Who Run Multiple Accounts
- Where to Verify These Claims
- Sources
What Are Iceberg Orders in Futures Trading?
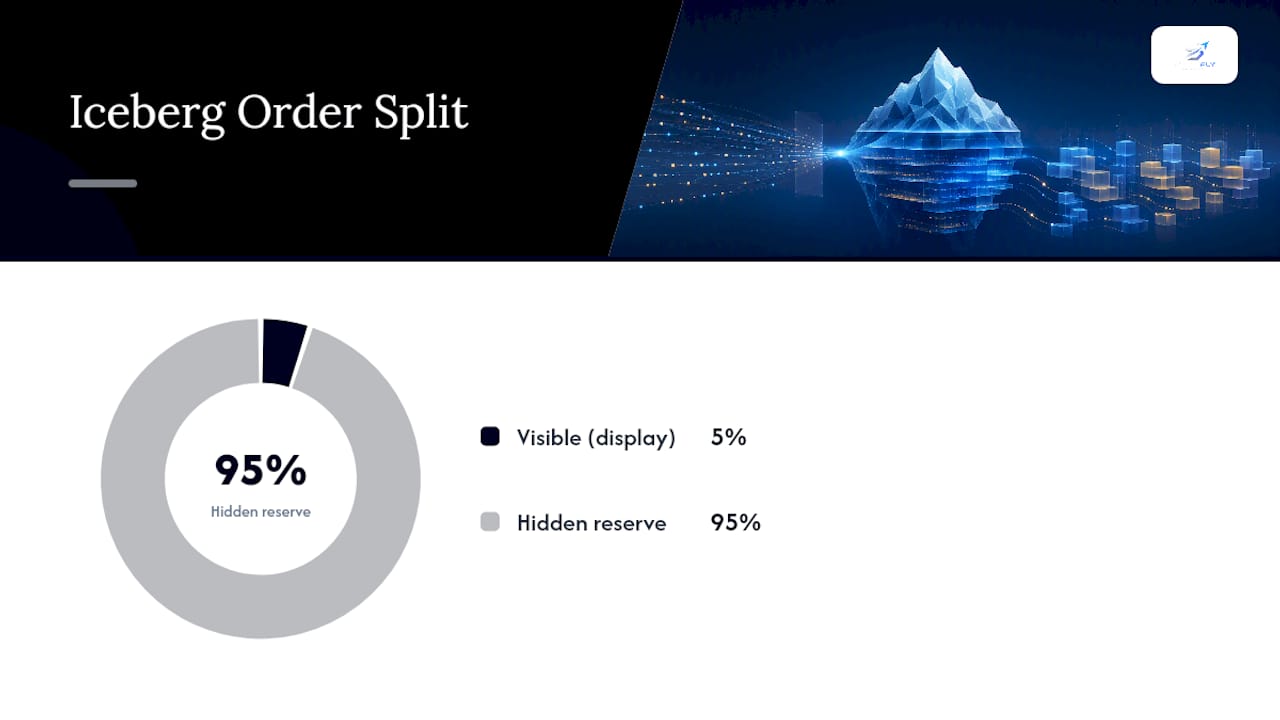
An iceberg order shows the market a fraction of its true size. A trader wanting to buy 500 contracts might display only 20 at a time; the remaining 480 sit hidden and release automatically each time the visible slice fills. This display quantity versus hidden reserve structure is the entire mechanism behind an iceberg order, and it's why the technique is also called a hidden order or reserve order in futures markets.
There are two ways to build one. A native iceberg is submitted directly to the exchange's matching engine, which manages the refresh logic internally. A manually sliced order relies on a trader or algorithm resending small clips, which introduces latency and creates a fragmented order ID trail rather than one persistent order.
Platform parameters typically include display quantity (a fixed number of contracts) and refresh behavior, sometimes expressed as a percentage of total size rather than an absolute figure. Say a trader sets a display quantity of 10 on a 200 lot order. Onlookers see 10 contracts. Each time those 10 fill, another 10 appear from the hidden reserve until all 200 are worked. Estimates suggest native futures icebergs often expose only 5% to 20% of total order size as the visible portion in liquid contracts like the E-mini S&P 500.
Which Exchanges Support Native Iceberg Orders?
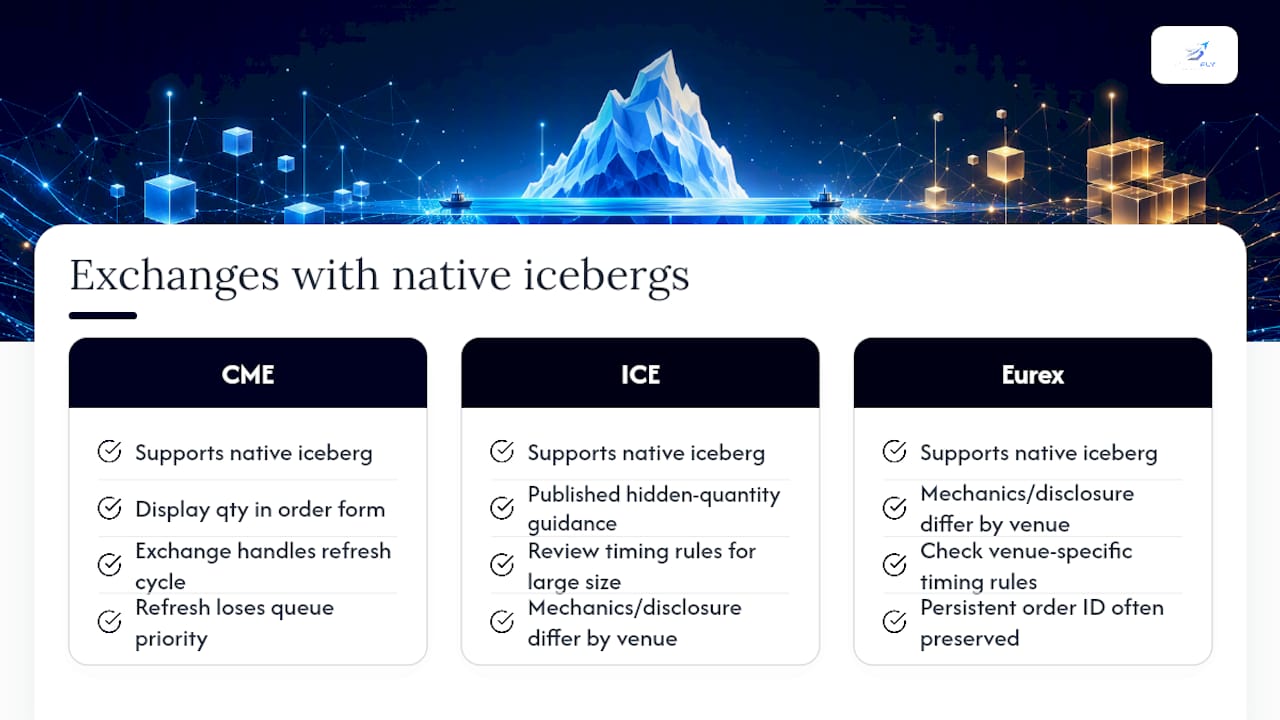
CME Group, ICE, and Eurex all offer native iceberg order types, though the mechanics and disclosure rules differ by venue. CME Group's own documentation walks through how to configure display quantity directly in the order entry form, confirming that the exchange, not the trader's platform, handles the refresh cycle.
That refresh carries a cost: every time the display quantity reloads, the new clip loses queue priority and moves to the back of the line at that price level. ICE publishes separate guidance on hidden quantity orders, including timing rules that traders working larger size should review before assuming identical behavior across venues. Market-by-order data feeds often preserve a persistent order ID across refreshes for native icebergs, which is the detail that separates a true iceberg from a string of coincidentally similar independent orders.
How Do You Detect Iceberg Orders on the Tape?
Three signatures show up again and again when hidden size is working a level. First, repeated fills print at the exact same price far more often than random order flow would produce. Second, cumulative traded volume at that price exceeds the visible depth shown on the DOM by a wide margin. Third, price absorbs real aggression without moving, which is the clearest tell that reserve size is refilling as fast as it gets hit.
Combining tools sharpens the read:
- Time and sales shows the raw print sequence and clip sizes.
- The depth of market (DOM) reveals whether displayed size keeps reappearing at an unchanged level.
- Heatmaps visualize resting liquidity over time, making a stubborn price shelf easy to spot at a glance.
- Footprint charts break volume down by price within each bar, exposing absorption that a simple candlestick would hide entirely.
A practical heuristic: if traded volume at a price runs three times or more beyond the visible resting size, and clip sizes repeat with low variance, an iceberg is a reasonable working theory rather than a coincidence. Detection guides built around this kind of pattern matching flag standard deviation of clip size and volume-to-depth ratios as the two most reliable filters, since either signal alone produces too many false positives from ordinary liquidity clusters.
Pro Tip: Backtest any detection rule on at least a few weeks of historical tape before trusting it live. A pattern that looks like an iceberg during a thin lunch session often turns out to be nothing more than a handful of resting limit orders from unrelated participants.
Trading Strategies for Iceberg Orders in Futures
- Trade with the flow (absorption entries). When you confirm a buy-side iceberg absorbing sell pressure, enter long on the same side once absorption is evident, place a stop just below the iceberg's price level, and size the position so a stop-out costs no more than your standard per-trade risk limit.
- Trade the exhaustion. Icebergs eventually run out. Watch for the reload clip shrinking, appearing more slowly, or failing to fully replenish after a fill. A confirmed weakening reload, followed by a break through the level on rising volume, is a reasonable signal for a breakout trade in the direction of the break.
- Confirm with delta and volume profile. An iceberg detection alone is a hypothesis. Cross-reference it with cumulative delta (is aggressive buying or selling actually building against the level?) and volume profile (is this price a high-volume node where resting size would naturally cluster?). Confluence between all three raises confidence meaningfully above any single signal.
- Size for uncertainty. Because you're inferring hidden size rather than observing it directly, position sizing should stay conservative relative to your normal setups, at least until the pattern confirms across multiple sessions.
Academic research on agricultural futures found that hidden orders represented more than 10% of volume in corn and over 20% in live cattle futures, with some E-mini S&P 500 samples showing hidden liquidity as high as 43%. At that scale, ignoring iceberg activity means trading against a meaningful share of the order flow without knowing it's there.
Execution Risks and a Pre-Trade Checklist
Concealment has a price. Every refresh cycle sends the reloaded clip to the back of the queue, so a large iceberg trades size slower than a fully displayed order would at the same price, and it risks adverse selection if the market moves before the reserve finishes working. Slippage tends to rise on thinner contracts, where a hidden order large enough to matter relative to average depth becomes easier for other participants to detect and trade around.
Before placing or trading into a suspected iceberg, run through a short checklist: confirm the instrument has enough baseline liquidity to support the size you're working, pick a display clip size proportional to typical resting depth rather than an arbitrary round number, attach a protective stop before you submit, and test the setup on small size before scaling up.
Operational Controls for Multi-Account Iceberg Execution
Detecting hidden liquidity is only half the job. Executing around it safely, especially across multiple accounts, calls for automation that never misses a fill or leaves a position unprotected. The controls that matter most are broker-side protective stops that survive a disconnection, daily profit and loss lockouts that cap damage from a bad session, and secure OAuth broker integration rather than stored credentials. Multi-account replication with stops enforced at the broker level, not just the platform, reduces the operational risk of working large slices manually.
What Iceberg Literacy Actually Changes for a Trader
Once you can identify hidden size, the DOM stops looking like a simple ledger of intent and starts looking like a probability map. The honest position is that detection is inference, not proof, so size every trade as if you could be wrong. My rapid checklist: confirm absorption on tape, cross-check with delta, size small, and let the exhaustion signal, not hope, trigger your exit.
— Arturo
An Automation Layer for Traders Who Run Multiple Accounts
Reading icebergs correctly is only useful if your execution can act on it consistently across every account you run. A trade mirroring setup can copy trades from a lead account to follower accounts automatically, so a confirmed absorption or exhaustion setup can be applied consistently instead of depending on manual copy speed under pressure.
Mirrored trades can include protective stops at the broker level that persist through disconnections, and daily profit and loss lockouts can help prevent a bad session from compounding across accounts. Connections typically run through secure OAuth rather than stored passwords, and integrated trade analytics with AI coaching can help traders assess performance over time. If you manage size across more than one Tradovate account, see how the mirroring and stop system works and review the risk disclosure before connecting your first account.
Where to Verify These Claims
For deeper technical reading, CME Group's own documentation on configuring iceberg orders is the authoritative source on native exchange behavior. Investopedia's iceberg order primer covers the core definition and detection basics well. The agricultural futures study on hidden liquidity prevalence backs the market-impact figures cited above, and traders wanting historical data to test detection rules can pull contract data from BacktestMarket's commodities archive.
Sources
- Looking under the surface: An analysis of iceberg orders in the U.S. agricultural futures markets
- Iceberg Orders — CME Group
- Iceberg Orders — Investopedia