

Multi account P&L aggregation means combining trade data from every account you trade into a single, normalized ledger that reports true realized and unrealized profit and loss. The correct method is a unified trade schema, currency-normalized aggregation, and per-account attribution built in that order. Start by inventorying every account, picking a single display currency, and importing raw data before you calculate anything.
TL;DR:
- Consolidating P&L across multiple accounts reveals correlated risks, hidden drawdowns, and fee drag that are invisible in isolated account reports.
- Proper normalization requires capturing timestamps, trade details, fees, and balance snapshots in a consistent schema, converting currencies at appropriate points.
- Aggregated P&L calculations must differentiate realized and unrealized profits, converting at execution and end-of-day rates respectively to avoid artificial fluctuations.
- Validating accuracy involves daily reconciliation of trade counts, balances, and sample trades, with alerts for FX rate anomalies or import gaps to catch errors early.
- Automating trade mirroring with tools like SafeFly reduces execution risk and disconnection issues, ensuring aggregated data remains reliable for decision-making.
Table of Contents
- What Is Multi Account PNL Aggregation and Why Does It Matter?
- What Data Do You Need From Each Account, and How Do You Normalize It?
- How Do You Actually Calculate Aggregated PNL?
- What's the Step-by-Step Checklist to Build a Consolidated View?
- What Dashboards and KPIs Should the Consolidated Data Power?
- What Pitfalls Break Aggregated Numbers, and How Do You Catch Them?
- How Does SafeFly Fit Into an Automated Multi-Account Workflow?
- Build vs. Buy: How Should You Decide?
- SafeFly: A Direct Path to Consolidated Multi-Account Control
- Primary Sources and Further Reading
- Sources
- FAQ
What Is Multi Account PNL Aggregation and Why Does It Matter?
Multi account P&L aggregation is the process of pulling raw trade, fee, and balance data from every account you operate and consolidating it into one report that reflects your true combined profitability. It differs from single-account reporting in one critical way: a single account statement tells you how one slice of your capital performed, but says nothing about whether your overall exposure across accounts is sane.
Traders who watch accounts in isolation routinely make two costly mistakes. First, they oversize a position because each individual account looks lightly loaded, missing that three accounts are all long the same contract at the same time. Second, they misread risk entirely, seeing a "profitable week" on one account while two others quietly bled through fees and slippage that never show up unless someone adds up the totals correctly.
Academic research on individual investor returns backs this up directly. Studies of retail trading performance show that naive performance measures produce biased and misleading results when trades and costs are not consolidated across the full set of accounts an investor controls. Partial views do not just miss information. They actively distort the signal you are using to make sizing and risk decisions.
Fragmented tracking tends to fail in the same recurring ways:
- Position sizing decisions get made without knowledge of correlated exposure across accounts.
- Aggregate drawdown goes unnoticed until it is severe, since no single account shows the full decline.
- Fee drag compounds silently across accounts that each look "fine" on their own.
- Genuine edge gets masked by one account's noise-canceling out another's real signal.
Consolidation fixes this by forcing every trade, fee, and balance into one comparable format before you draw any conclusion about performance.
What Data Do You Need From Each Account, and How Do You Normalize It?
Every broker and platform reports P&L slightly differently, which is exactly why raw exports cannot simply be added together. A unified schema is the only way to make consolidation meaningful, because comparing a broker that nets fees into P&L against one that reports them separately produces numbers that look precise but mean nothing.
Pull these fields from every account before you build anything else:
- Timestamps for every fill, in a consistent time zone (UTC is the safest default).
- Fill-level trade data: instrument, direction, size, entry price, exit price.
- Fees and commissions, itemized separately from gross P&L, not netted in.
- Realized vs. unrealized flags on every open and closed position.
- Account balance snapshots at a fixed daily cutoff, ideally end of day in your chosen time zone.
- Currency denomination of the account and of each trade, if they differ.
The realized versus unrealized distinction deserves particular care. Realized P&L is closed and final; unrealized P&L reflects open positions marked at a point-in-time price that can reverse before you ever collect it. Blending the two without labeling them separately is one of the most common ways aggregated dashboards mislead traders into thinking they are more profitable, or less exposed, than they actually are.
Currency normalization follows a similar logic. If you trade a single-currency instrument like Tradovate futures across accounts, this step is simpler, but any multi-currency portfolio needs a firm rule: convert at execution price for realized trades, and at end-of-day (EOD) rates for unrealized marks and balance snapshots. Mixing the two conversion points inside the same report creates phantom P&L swings that have nothing to do with your trading.
Tag every account with metadata before data ever hits your dashboard: strategy name, account type (live, funded, prop, test), and purpose (income, evaluation, hedge). Provider-specific field variability is real enough that even open-source tooling built around multi-account plugins has had to build explicit mapping logic just to reconcile column names across brokers.
Pro Tip: Store the original currency value and the original raw field alongside the converted, normalized number. If you only save the converted figure, you lose the ability to audit or correct a bad FX rate months later.
How Do You Actually Calculate Aggregated PNL?
Three methods exist, and they are not interchangeable. Naive sum adds every account's reported P&L figure directly, ignoring currency and definitional differences entirely. It's fast and it's frequently wrong. Normalized sum converts every figure into one display currency using consistent conversion rules before adding, which fixes the currency problem but still treats accounts as independent silos. Equity-curve aggregation goes further, plotting combined account equity over time, which captures compounding effects and timing that a simple sum misses entirely.
The formula for normalized aggregate P&L is straightforward once your inputs are clean:
Aggregate P&L = Σ (Realized P&L in local currency × FX rate at execution) + Σ (Unrealized P&L in local currency × FX rate at EOD) − Σ (Fees and commissions, in display currency)
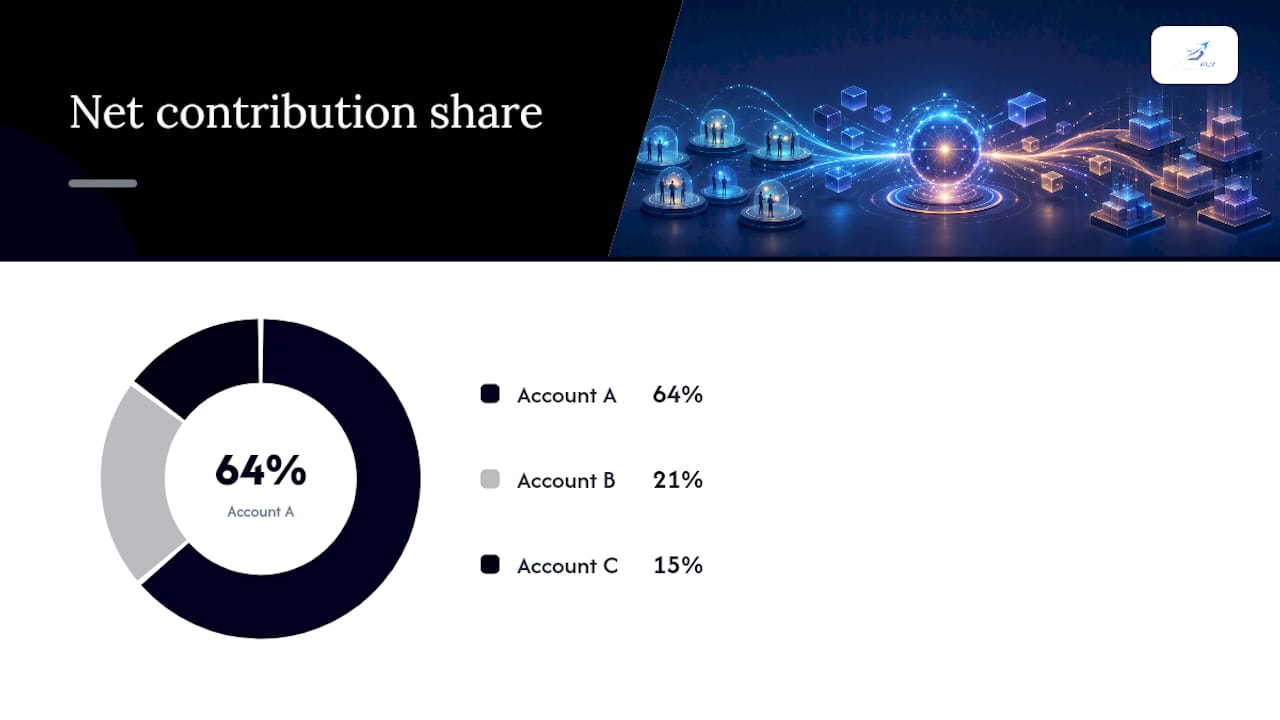
Per-account contribution then breaks that total down by source, in both absolute and percentage terms, which is where most of the useful decision-making information actually lives.
Here's a compact worked example using three Tradovate accounts, all denominated in US dollars, which removes the FX conversion step and isolates the aggregation math:
| Account | Realized P&L | Unrealized P&L | Fees | Net Contribution |
|---|---|---|---|---|
| Account A (live) | $4,270 | $800 | $200 | $3,270 |
| Account B (funded) | $1,670 | $0 | $200 | $1,100 |
| Account C (test) | $600 | $200 | $40 | $760 |
| Aggregate | $4,270 | $220 | $200 | $4,270 |
Without that breakdown, a trader glancing only at the $4,270 aggregate figure would never notice that Account C's unrealized $200 is still fully at risk of reversing before it locks in.
What's the Step-by-Step Checklist to Build a Consolidated View?
Building this correctly the first time saves you from re-auditing months of bad numbers later. Work through these steps in order:
- Inventory every account you trade and label its role: live, prop-funded, evaluation, test, or follower.
- Choose your display currency and lock in a reliable FX data source you will use consistently.
- Decide your conversion timing rule now: execution-price conversion for realized trades, EOD rates for unrealized marks and balances.
- Connect or import data through the most reliable channel each broker supports: a secure API, CSV export, or read-only investor password. Avoid manual copy-paste wherever an automated option exists.
- Map every field from each source into your unified schema before any calculation runs.
- Standardize tags across accounts: strategy, account type, purpose, so filtering and attribution work cleanly later.
- Set fee treatment rules explicitly and apply them identically across every account, whether a broker nets fees into P&L or reports them separately.
- Run a reconciliation pass: compare trade counts and closing balances against each broker's own statement before trusting the aggregate.
- Automate the import schedule and configure alerts for missed imports, since a silent gap in one account's data quietly corrupts the whole aggregate.
- Retain every raw source file you import. If a number is ever disputed, you need the original export to defend it.
Pro Tip: Run your first month of aggregation in parallel with manual spot-checks against each broker's own statement. Trust the automated pipeline only after it matches manual totals for at least a few consecutive weeks.
What Dashboards and KPIs Should the Consolidated Data Power?
A consolidated dataset is only as useful as what you build on top of it. The core visualizations that matter for active multi-account trading are the combined equity curve, cumulative P&L over time, a rolling P&L window (trailing 7 or 30 days), and a month-by-month performance heatmap that instantly exposes seasonality or drawdown clusters.
Attribution needs its own layer. A per-account contribution table paired with a waterfall chart is the fastest way to see which accounts are actually driving portfolio results and which ones are quietly dragging on it, a point that aggregated dashboard design consistently reinforces. Without that breakdown, a strong month on one account can mask a losing month on another until the pattern becomes expensive to ignore.
Operational views round out the picture:
- Open positions snapshot across every account, updated in near real time.
- Live versus closed trade lists, filterable by account and strategy.
- Exposure by symbol, so correlated positions across accounts are visible before they compound risk.
- Aggregate drawdown alongside per-account drawdown, shown side by side rather than buried in separate tabs.
- Daily P&L lockout triggers, so you can see at a glance which accounts are approaching a risk limit before it's breached.
Platforms built specifically for managing many funded or live accounts increasingly bundle exactly this: combined equity, floating P&L, drawdown tracking, and rule-based alerting in one interface, precisely because scattered logins make this kind of oversight impractical to maintain by hand.
What Pitfalls Break Aggregated Numbers, and How Do You Catch Them?
Four errors account for most bad aggregate numbers: inconsistent P&L definitions between brokers, missing or double-counted fees, transfers between your own accounts counted as trading profit or loss, and FX timing mismatches from mixing execution and EOD rates in the same report. Internal transfers deserve specific attention: moving capital from Account A to Account B is not a trading gain or loss, and any aggregation pipeline that doesn't explicitly flag and exclude intra-group transfers will inflate or deflate your real performance without you noticing.
Run these validation checks on a fixed schedule, not just when something looks wrong:
- Reconcile trade counts per account against each broker's own statement.
- Set a daily opening and closing balance checkpoint for every account.
- Audit a random sample of trades each week against the source export.
- Cross-check per-account totals against the published aggregate to confirm they sum correctly.
A robust reconciliation flow combining trade-count parity, balance checkpoints, sample-trade replay, and FX revaluation checks catches the overwhelming majority of aggregation errors before they reach a decision. Configure alerts for a missing daily import, an unusually large FX delta, or a sudden spike in one account's contribution share, and document every fix you make along with the raw import it corrected.
How Does SafeFly Fit Into an Automated Multi-Account Workflow?
Once your checklist is running manually, the next question is whether to automate the operational side of it, particularly for futures traders juggling several Tradovate accounts at once. SafeFly addresses the execution-risk layer that sits underneath any aggregation project: it mirrors trades from a lead account to follower accounts automatically, so you are not manually replicating orders under time pressure.
- Every mirrored trade carries a broker-side protective stop, which stays active even if your connection drops.
- Daily profit and loss lockouts enforce risk limits automatically across every connected account, reducing the chance of overtrading after a losing stretch.
- Integrations run through secure OAuth connections, so account credentials are never stored, keeping your data imports reliable for the aggregation pipeline you build on top.
- Server-side checks and broker-side stops materially reduce disconnect risk compared to manual replication across accounts.
Build vs. Buy: How Should You Decide?
If you run two accounts and trade weekly, a spreadsheet works fine. Past four or five accounts, meaningful capital, or prop firm rules, manual tracking's error rate and setup time start costing more than a subscription would.
— Arturo
SafeFly: A Direct Path to Consolidated Multi-Account Control
SafeFly is the automation layer for traders who have already built the aggregation logic above and don't want to execute it by hand every session. Instead of manually copying trades across Tradovate accounts and hoping every stop gets placed before a disconnect, SafeFly mirrors trades from your lead account automatically, attaches a broker-side protective stop to every copy, and enforces daily P&L lockouts so one bad session doesn't compound across every account you run.

The Ultra plan adds a dealer gamma-exposure screener directly into the platform, useful for traders layering market-structure context on top of their consolidated P&L view. Every integration runs through secure OAuth connections rather than stored passwords, which keeps the same data feed you use for aggregation reliable and auditable. Review the how it works page for the full mechanics, then compare the Basic, Pro, and Ultra plans starting at $49 per month to find the tier that matches how many accounts you run, and start your trial from there.
Primary Sources and Further Reading
- Customer Profitability Analysis, Part I (Kansas City Fed)
- Profitability analysis: a comprehensive guide (Fathom)
- Kodėl diversifikuoti valiutų portfelį: rizika ir nauda
Sources
- Monitor All Funded Accounts with a Multi-Account Prop Firm Dashboard | DeckLive
- Summary Analysis — FX Monitor
- Profitability analysis: a comprehensive guide (Fathom)
FAQ
What Is Multi Account PNL Aggregation?
Multi account P&L aggregation is the process of combining trade, fee, and balance data from every trading account you operate into one normalized report showing true combined profit and loss. It requires a consistent schema and currency conversion rules so figures from different brokers are actually comparable.
How Do I Convert Currencies When Aggregating P&L Across Accounts?
Convert realized P&L at the execution-time exchange rate and convert unrealized P&L and balance snapshots at end-of-day rates. Mixing the two conversion points in the same report creates artificial P&L swings that have nothing to do with actual trading performance.
What's the Biggest Mistake Traders Make When Consolidating Accounts?
The most common error is treating internal transfers between your own accounts as trading gains or losses instead of excluding them from the P&L calculation. Missing or double-counted fees and inconsistent realized-versus-unrealized treatment across brokers cause the next most frequent distortions.
Does SafeFly Help With Multi Account PNL Tracking?
SafeFly focuses on automating trade replication and risk controls across Tradovate accounts, including broker-side protective stops and daily P&L lockouts, which reduces the execution errors that corrupt aggregated numbers in the first place. Pricing starts at $49 per month on the Basic plan, with Pro and Ultra tiers available for traders running more accounts or wanting advanced analytics.
How Often Should I Reconcile Aggregated P&L Against Individual Statements?
Run trade-count and balance reconciliation checks daily, with a deeper sample-trade audit weekly. Waiting longer lets a single bad import or FX timing error compound across weeks of reporting before anyone catches it.