

Three numbers determine whether a strategy holds up: expectancy, maximum drawdown, and sample size. Expectancy tells you the average result per trade after costs. Drawdown tells you how much pain you absorb along the way. Sample size tells you whether either number deserves trust. Everything else in a trading performance metrics dashboard, win rate, Sharpe ratio, profit factor, exists to explain or refine those three.
TL;DR:
- A sample of at least 20 trades is necessary to reliably judge a strategy, but confidence improves with larger, out-of-sample data spanning multiple market regimes.
- Expectancy and profit factor are key metrics that reveal whether a strategy has a genuine edge, with expectancy above zero being a strong signal.
- Drawdown and R-multiples provide insight into the ride and risk profile, highlighting the importance of proper initial risk logging and maximum drawdown management.
- Automated trade recording and broker-side stops significantly reduce execution errors and slippage, enhancing the accuracy of performance metrics.
- Emotional biases influence how traders interpret their numbers, so regular, scheduled reviews help maintain objectivity and prevent rash decision-making.
Table of Contents
- What Are the Main Categories of Trading Performance Metrics?
- Win Rate, Payoff Ratio, Expectancy, and Profit Factor: The Formulas That Matter
- Drawdown, Recovery Time, and R-Multiples: Measuring the Ride, Not Just the Destination
- Sharpe, Sortino, MAE/MFE, and Execution Error: What the Diagnostics Reveal
- How Do You Track These Metrics Without Losing Accuracy?
- How Many Trades Do You Need Before Trusting the Numbers?
- Building a Minimal Live Performance Dashboard
- A Practitioner Note on Automated Execution Controls
- Why Traders Misread Their Own Numbers
- Where to Start When Fixing Weak Metrics
- A Practical Next Step for Multi-Account Futures Traders
- Sources
What Are the Main Categories of Trading Performance Metrics?
Trading metrics fall into five functional groups, and confusing one category for another is where most self-assessment goes wrong. A trader who only checks win rate is answering "how often did I get paid," not "did I make money" or "how much risk did I carry to get there."
- Outcome metrics (net P&L, return percentage) answer whether the account grew.
- Payoff and frequency metrics (win rate, average win/loss, trade count) describe how often and how much.
- Edge summary metrics (expectancy, profit factor) compress payoff and frequency into a single verdict on whether the strategy has a statistical advantage.
- Path risk metrics (max drawdown, drawdown duration, R-multiples) measure the ride, not just the destination.
- Diagnostic metrics (MAE/MFE, execution error rate, exposure time) explain why the other numbers look the way they do.
A concrete link: if maximum drawdown creeps past a preset threshold, a relatively low percentage of account equity, that is a position-sizing decision, not a strategy-abandonment decision. If expectancy turns negative while win rate stays flat, the diagnostic layer (probably execution error rate or slippage) usually holds the answer. Reading one category in isolation is how traders convince themselves a broken system is fine, or abandon a good one over a normal losing streak. The core metric set traders track most consistently spans all five groups for exactly this reason.
Win Rate, Payoff Ratio, Expectancy, and Profit Factor: The Formulas That Matter
Win rate is the simplest metric and the most misleading one read alone. It is calculated as:
Win Rate = Winning Trades ÷ Total Trades
A high win rate sounds dominant until you learn the average loss can be several times larger than the average win. That trader loses money on net despite winning most of the time. This is why payoff ratio has to travel with win rate, never separately.
Payoff Ratio = Average Win ÷ Average Loss
Say your average winning trade nets an amount twice the average loss. That payoff ratio means a win rate around one-third can still be profitable.
Expectancy folds both numbers into one figure that tells you what you can expect to earn, on average, per trade:
Expectancy = (Win Rate × Average Win) − (Loss Rate × Average Loss)
That is a real edge, even though the strategy loses on nearly two out of three attempts. This is the metric that decides whether a system is worth trading, and it is why expectancy outperforms win rate as the number traders should obsess over.
Expectancy above zero across a large, unbiased sample is the single clearest signal a strategy has a genuine edge, according to guidance that recommends judging systems on at least 20 trades minimum before drawing conclusions.
Profit factor measures the same edge from a different angle:
Profit Factor = Gross Profit ÷ Gross Loss
- A profit factor above 1.0 means total winnings exceeded total losses for the sample.
- A profit factor of 1.5 to 2.0 is generally considered a solid, sustainable range for active strategies.
- A profit factor above 3.0 on a small sample often signals an unrepresentative lucky streak rather than durable skill, according to risk-adjusted metrics guidance.
Net P&L and return percentage close the loop, but only if you include every real cost: commissions, exchange fees, and slippage. A backtest showing $12,000 in gross profit means little if live execution costs erode a third of it. Net figures should always be quoted after costs, never before.
Drawdown, Recovery Time, and R-Multiples: Measuring the Ride, Not Just the Destination
Maximum drawdown measures the largest peak-to-trough decline in account equity, expressed as a percentage or dollar figure. If an account peaks and later drops significantly before recovering, that decline—called drawdown—is expressed as a moderate percentage, regardless of what the account does afterward.
Two traders can post identical net returns with wildly different experiences getting there. The second trader carried far more path risk for the same result, and most position-sizing rules that ignore this end up oversized for the strategy's real volatility.
- Drawdown duration measures how long an account stays below a prior equity peak, sometimes called time under water.
- Recovery time measures how long it takes to climb back to a new high after a drawdown bottoms out.
- R-multiples express every trade's result as a multiple of the initial dollar risk, so a trade risking $200 that nets $600 profit is a "3R" trade regardless of instrument or size.
R-multiples only work if you freeze the initial risk at trade entry and never restate it after adjusting a stop. Moving the stop and recalculating "R" after the fact hides the real risk taken and corrupts every expectancy calculation downstream. A trailing max-drawdown rule, set as a hard equity floor that cuts trading size or halts trading entirely, is one of the more reliable practical safeguards against a small losing streak becoming a career-ending one.
Pro Tip: Log initial risk in dollars at the moment you enter, not the moment you exit. Recalculating "R" after moving a stop is the single most common way traders quietly overstate their edge to themselves.
Sharpe, Sortino, MAE/MFE, and Execution Error: What the Diagnostics Reveal
Sharpe ratio measures return per unit of volatility:
Sharpe Ratio = (Return − Risk-Free Rate) ÷ Standard Deviation of Returns
Its flaw for active traders is that it penalizes upside volatility the same as downside volatility. A strategy with occasional large winners looks "riskier" by Sharpe's math even when that variance is exactly what you want. Sortino ratio fixes this by only counting downside deviation in the denominator, which makes it the better fit for strategies with asymmetric, skewed return profiles common in trend-following or breakout systems.
- MAE (Maximum Adverse Excursion) tracks how far a trade moved against you before it closed, revealing whether your stop is too tight or too loose.
- MFE (Maximum Favorable Excursion) tracks how far a trade moved in your favor before you exited, exposing profit targets left on the table.
- Execution error rate logs the gap between intended and filled price or size, a number every automated or multi-account trader should track separately from strategy performance.
- Duration and exposure time measure how long capital sits at risk per trade, which matters for comparing strategies with different holding periods.
If your average MAE is consistently deep and trades still finish as winners, your stops are probably too tight for the setup's normal noise. Reviewing MFE data against realized exits is usually the fastest way to find a profit target that is leaving money on the table.
How Do You Track These Metrics Without Losing Accuracy?
Every trade record needs the same fixed set of fields, recorded at entry, not reconstructed later from memory.
- Timestamp, instrument, and position size.
- Entry price, stop price, and target price.
- Initial dollar risk, frozen at entry and never revised.
- Realized P&L, fees, and estimated slippage, recorded separately.
- Setup tag, market regime, and any discretionary override notes.
A manual spreadsheet works for traders under roughly 50 trades a month and forces discipline through friction, but it invites transcription errors and delayed entries. Automated import from your broker removes that lag and scales past a few hundred trades a month, though it depends on clean data feeds and consistent tagging conventions, a gap that automated journal tools are built specifically to close. Whichever method you pick, keep backtest and live-trading conventions identical, same cost assumptions, same rounding, or your comparisons will quietly drift apart. The most common recording mistake is restating initial risk after moving a stop; the second most common is omitting slippage entirely.
How Many Trades Do You Need Before Trusting the Numbers?
Twenty to fifty trades is a reasonable floor for an early read, a threshold echoed in guidance recommending at least 20 trades before judging a system. That is a floor, not a finish line. Confidence builds with bootstrapped resampling of your trade log and genuine out-of-sample testing, data the strategy never saw during development.
- Split results by market regime (trending, ranging, high volatility) since a strategy that thrives in one can bleed in another.
- Check that your sample spans multiple regimes, not one lucky quarter.
- Confirm exposure and costs were consistent across the sample, not front-loaded with favorable fills.
Out-of-sample research on technical indicators found many fail to beat a simple buy-and-hold benchmark on raw return, yet still earned their place by reducing portfolio volatility. Judge added complexity by what it does to your drawdown, not just your headline return.
Building a Minimal Live Performance Dashboard
A working dashboard needs only nine numbers, checked on a consistent schedule rather than every time you feel anxious about a trade.
- Trade count for the period.
- Net P&L after all costs.
- Expectancy per trade.
- Profit factor.
- Maximum drawdown, current and historical.
- Average R-multiple.
- Current losing streak length.
- MAE/MFE distribution summary.
- Execution error rate.
| Cadence | What to check | Sample alert threshold |
|---|---|---|
| Daily | Losing streak, execution errors | 5+ consecutive losses or any missed stop fill |
| Weekly | Expectancy, profit factor trend | Expectancy turns negative over 15+ trades |
| Monthly | Drawdown, R-multiple distribution, regime fit | Drawdown exceeds prior historical maximum |
If expectancy starts falling while profit factor holds steady, the leak is usually execution or cost related, not the strategy's core logic. If both fall together, the edge itself may be regime-dependent and worth a full out-of-sample recheck.
A Practitioner Note on Automated Execution Controls
Manual trade replication across multiple Tradovate accounts introduces execution error at exactly the moment speed matters most. Broker-side protective stops close that gap by attaching a stop to every mirrored position at the broker level, which limits realized slippage even through a disconnection. Daily profit and loss lockouts cap the downside on any single trading day, directly bounding one contributor to maximum drawdown.
- Automated tagging speeds MAE/MFE review by pairing every trade with its excursion data automatically.
- Broker-side stops reduce the execution error rate diagnostic without requiring manual intervention.
- Daily lockouts function as a built-in trailing risk control rather than a discretionary decision made under stress.
Why Traders Misread Their Own Numbers
The numbers on a performance dashboard are not neutral. A trader who just lived through a five-trade losing streak reads a flat expectancy chart very differently than one who just hit a new equity high, even when the underlying data is identical. Recency bias inflates the emotional weight of the last few trades far beyond their statistical importance in a sample of 200.
Loss aversion pushes traders to widen stops mid-trade to avoid "locking in" a loss, which corrupts the R-multiple data used to calculate expectancy in the first place. Confirmation bias works the other way: a trader convinced a strategy works will scan a messy equity curve and see confirmation, while a skeptic staring at the same chart sees failure. Neither read is really about the data.
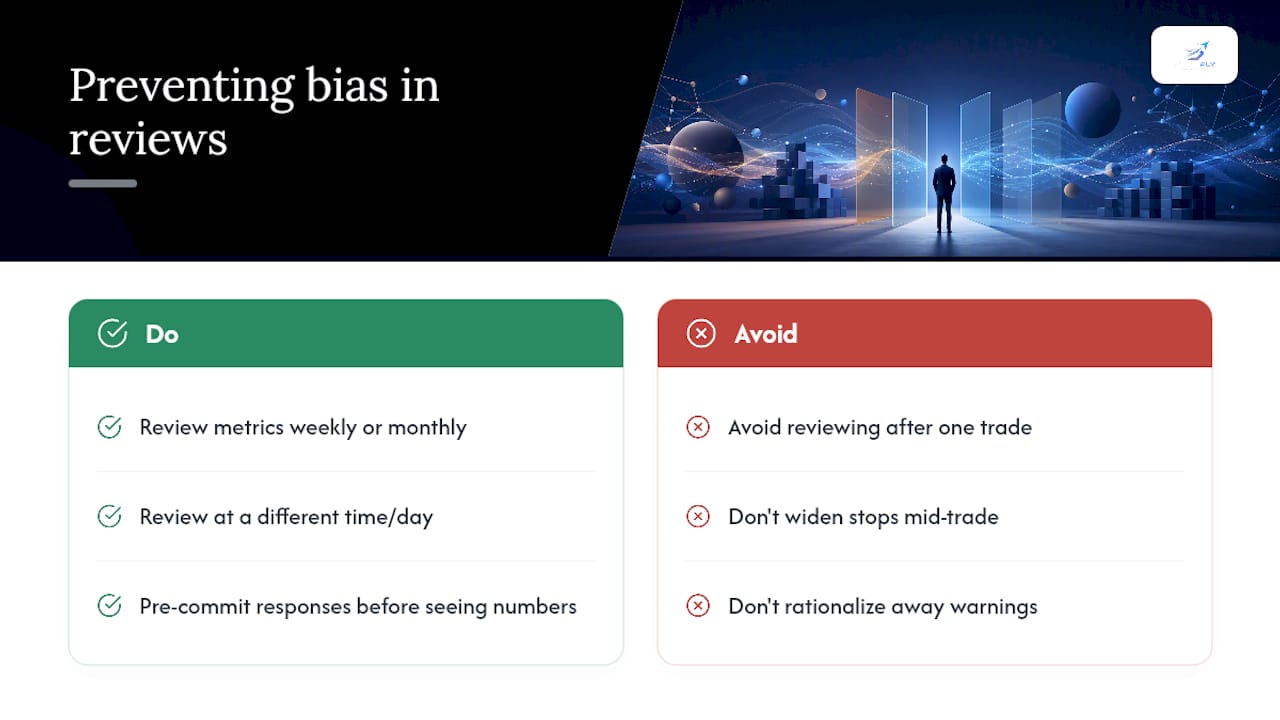
The fix is procedural, not emotional. Review metrics on a fixed schedule, weekly or monthly, never after a single trade or a short streak. Separate the review from the trading session entirely, ideally a different time of day or a different day of the week. Pre-commit to what response a given metric change actually warrants (cutting size, pausing, or no action) before you see the number, not after. A trader who decides in advance that three consecutive losing days triggers a size cut is far less likely to rationalize away a real warning sign in the moment it appears.
Where to Start When Fixing Weak Metrics
Fix the recording process first. Clean data beats clever analysis. Then check expectancy and drawdown together, use MAE/MFE and execution error rate to find the actual leak, and only then adjust indicators. Test changes on small samples, and never let a strategy's frozen risk-per-trade drift mid-test.
— Arturo
A Practical Next Step for Multi-Account Futures Traders
If you manage more than one Tradovate account, manual trade replication is where most execution error actually comes from, not your strategy logic. A platform can mirror trades from a lead account to other accounts automatically, attach a protective stop to every position, and enforce daily profit and loss lockouts so a bad day stays bounded.
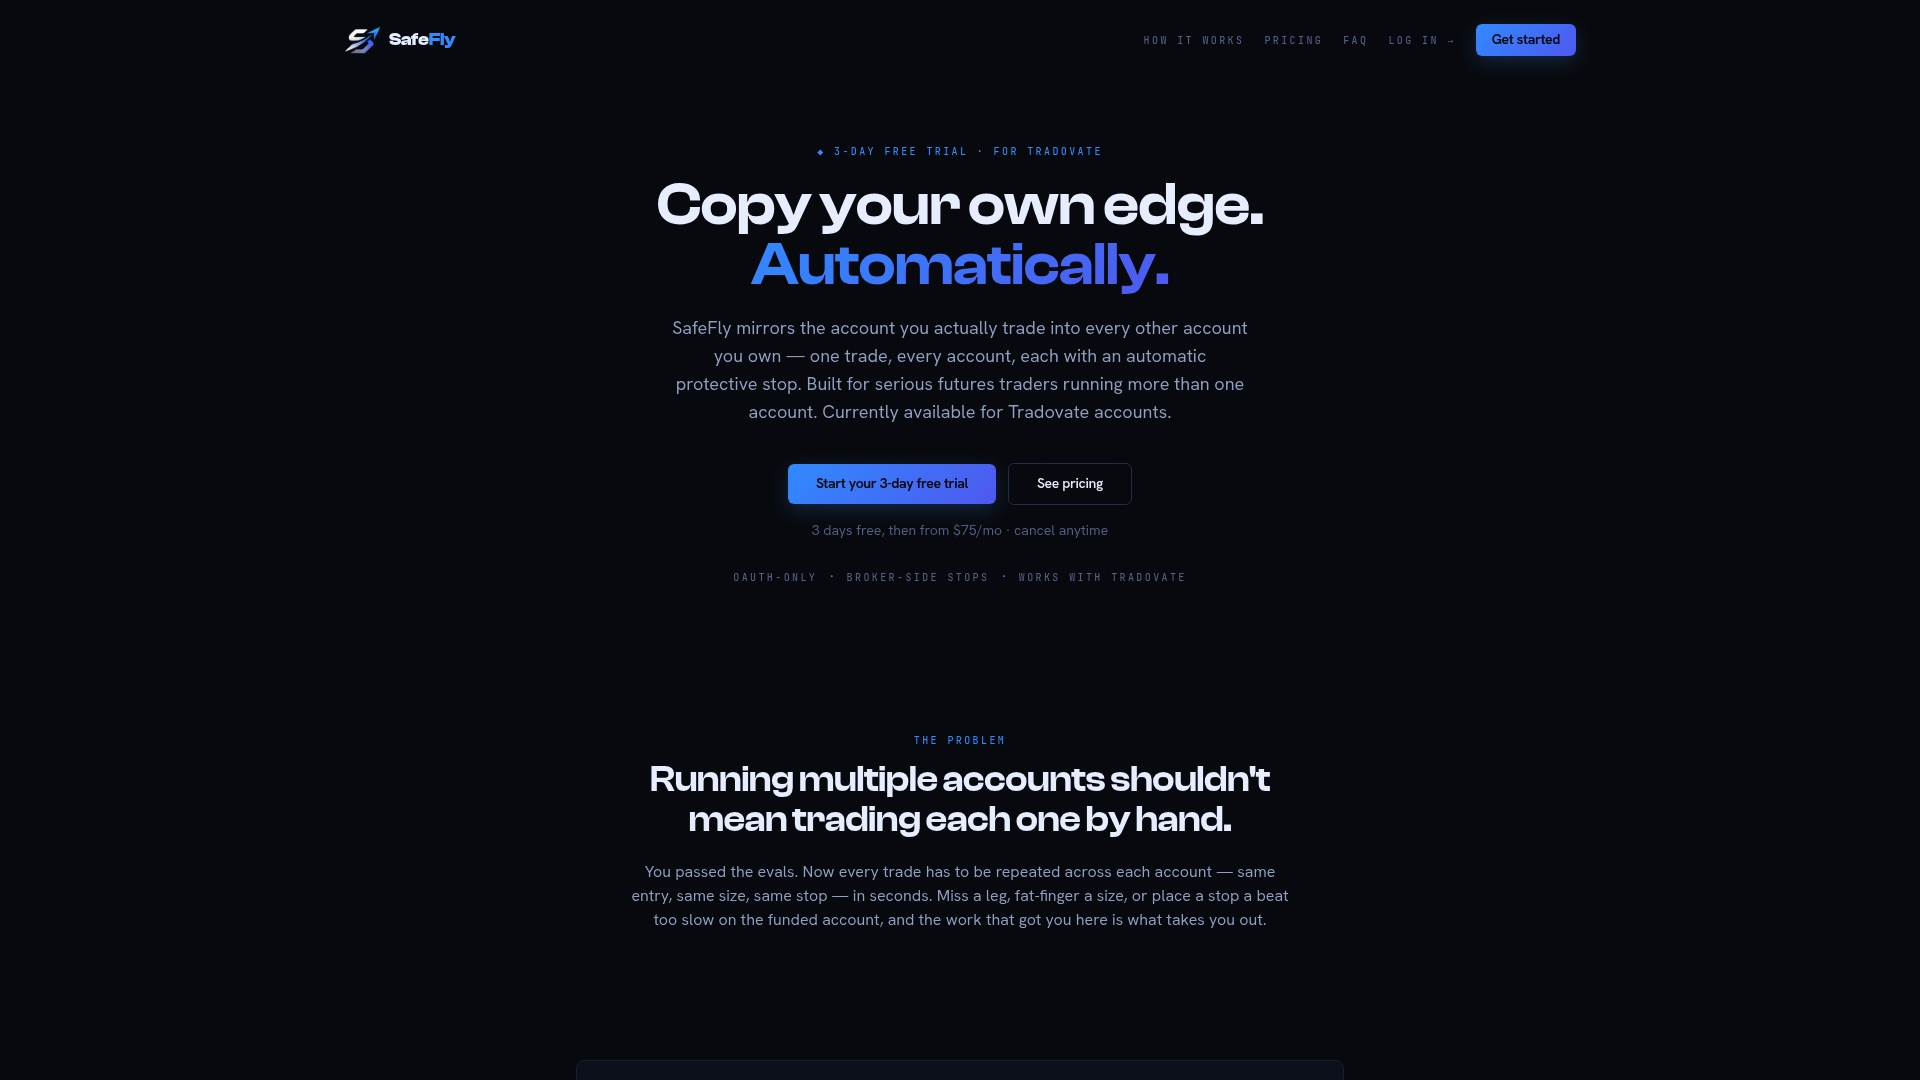
That combination shows up directly in the metrics covered above: fewer manual entry mistakes lower your execution error rate, and broker-side stops that survive a disconnection tighten your realized MAE compared to relying on a platform-side stop alone. Built-in analytics and AI coaching can tag trades automatically, so expectancy and drawdown numbers update without a separate spreadsheet pass. Serious futures traders running two, three, or more Tradovate accounts get value from automating trade replication to reduce errors. Visit the how SafeFly works page to see the mirroring and lockout setup in detail, or start a trial to see how it fits your current account structure.
Sources
- Trading Performance Metrics: Expectancy, PF & Drawdown | ChartMini Blog
- Babypips
- Quantifiedstrategies
- Indicator efficacy and out-of-sample testing (IndicatorEdge / repository paper)