

Expectancy, not win rate, determines whether a strategy makes money over time. Expectancy is the expected value per trade, calculated as (Win% × Avg win) − (Loss% × Avg loss), and a positive result predicts long-run profitability. Win rate only measures how often you're right, which tells you nothing about the size of your wins relative to your losses. The sections below break down the formulas, walk through worked examples, and show you how to calculate both metrics from your own trade log.
TL;DR:
- A strategy's profitability depends on positive expectancy, which accounts for average wins, losses, and their probabilities, not just win rate.
- Even a high win rate can result in losses if the reward-to-risk asymmetry favors larger losses or smaller wins.
- Calculating expectancy in R-multiples helps compare strategies regardless of position size and reveals true edge.
- Reliable expectancy insights require a sample of at least 100 trades, while profit factor above 1.3 indicates a genuine edge.
- Focusing on increasing average win and reducing average loss, along with proper position sizing, is key to improving expectancy.
Table of Contents
- Expectancy vs Win Rate: What Win Rate Actually Measures
- What Expectancy Is and How to Express It in R
- Two Trading Setups With Identical Win Rates, Different Outcomes
- How to Calculate Expectancy From Your Trade Log
- Sample Size, Profit Factor, and Drawdown Benchmarks
- Three Levers That Actually Move Your Expectancy
- Why Expectancy Deserves More Attention Than Win Rate Gets
- The Real Lesson Traders Miss About Win Rate
- Track Expectancy Across Every Tradovate Account You Run
- Sources
Expectancy vs Win Rate: What Win Rate Actually Measures
Win rate is the simplest metric in trading: Winning trades ÷ Total trades. A trader who wins 7 out of 10 trades has a 70% win rate. It feels good to look at, and that's exactly the problem.
Win rate carries an emotional pull because it mirrors how humans judge success in everyday life, being right most of the time feels like winning. But a high win rate can coexist with a losing system if the losses, when they happen, dwarf the wins.
Picture a strategy that wins 8 out of 10 trades, but each win nets $50 while each loss costs $400. That's an
win rate and a strategy that bleeds money.- Win rate ignores payoff size entirely.
- A trader can be "right" most of the time and still go broke.
- The metric says nothing about risk exposure per trade.
What Expectancy Is and How to Express It in R
Expectancy answers the question win rate can't: how much do you expect to make, on average, per trade? The dollar-based formula is straightforward: E = (Win% × Avg win) − (Loss% × Avg loss). Plug in your numbers, and you get a single figure that predicts profitability over a large sample.
The more useful version for comparing strategies is expectancy in R-multiples, where R represents your initial risk per trade: E(R) = (Win% × Avg win in R) − (Loss% × Avg loss in R). Expressing expectancy in R strips out position-sizing noise, so a strategy risking $200 per trade and one risking $2,000 per trade can be compared on equal footing.
Two things traders often skip:
- Average win and average loss should be calculated net of commissions and slippage, not gross.
- A strategy that looks profitable on paper can turn negative once execution costs are included, which is why journal-based calculation matters more than backtest assumptions.
Expectancy in plain terms: if your expectancy is +0.35R per trade, you expect to make 0.35 times your risk amount on every trade, averaged across a large sample. That's the number that actually governs your equity curve.
Two Trading Setups With Identical Win Rates, Different Outcomes
Numbers make the difference between win rate and expectancy concrete. Consider two setups traded 100 times each.
- Setup A (low win rate, high payoff): Wins 40% of the time, averaging $600 per win. Loses 60% of the time, averaging $200 per loss. Expectancy = (0.40 × $600) − (0.60 × $200) = $240 − $120 = +$120 per trade. Over 100 trades, that's roughly $12,000 in expected profit.
- Setup B (high win rate, low payoff): Wins 70% of the time, averaging $150 per win. Loses 30% of the time, averaging $400 per loss. Expectancy = (0.70 × $150) − (0.30 × $400) = $105 − $120 = −$15 per trade. Over 100 trades, that's an expected loss near $1,500.
Setup B wins almost twice as often as Setup A, yet it's the one that loses money. The lesson isn't that low win rates are good, it's that reward-to-risk asymmetry can override hit rate entirely. This is also why many trend-following and managed futures approaches operate profitably with win rates between 30% and 45%, because their winners run far longer than their losers.
How to Calculate Expectancy From Your Trade Log
Your trade log already contains everything you need. Here's how to turn it into an expectancy figure you can trust.
- Extract the raw data. For each trade, record entry price, exit price, dollar profit or loss, and the initial stop distance in R (your risk unit).
- Separate wins from losses. Calculate average win in dollars and average loss in dollars, then convert each to R by dividing by your risk-per-trade.
- Calculate win% and loss%. Divide winning trades and losing trades by total trades.
- Plug into the formula. Compute both the dollar expectancy and the R-based expectancy so you can compare this strategy against others regardless of position size.
- Find your breakeven win rate. Using 1 / (1 + reward:risk), a strategy with a 2:1 reward-to-risk ratio only needs to win 33% of trades to break even. Anything above that threshold is where your real edge lives.
Pro Tip: Track expectancy in R every week, not just at month-end. A shift from +0.25R to +0.10R often shows up in your log weeks before it shows up in your account balance.
A full walkthrough of the expectancy formula with Tradovate-specific examples can help you build this into a repeatable weekly habit.
Sample Size, Profit Factor, and Drawdown Benchmarks
A single expectancy number is only as trustworthy as the sample behind it. Fewer than 30 trades is closer to anecdote than data. Between 30 and 100 trades gives you a rough sketch. Past 100 trades, the figure becomes something worth acting on.
Profit factor, total gains divided by total losses, adds a second lens. A profit factor above 1.3 over roughly 100 or more trades suggests a genuine edge; below 1.1, the edge is likely too thin to survive live execution costs.
Neither metric replaces checking drawdown. Maximum drawdown should be reviewed before win rate, and a drawdown exceeding 20% is often a disqualifying signal regardless of how attractive the win rate looks.
- Under 30 trades: treat expectancy as a hypothesis, not a conclusion.
- 30 to 100 trades: directional signal, still fragile.
- 100+ trades: actionable data, especially if profit factor holds above 1.3.
- Always check max drawdown across at least one volatile market regime, not just a calm stretch.
Reviewing how trailing drawdown limits function can help you set realistic risk boundaries before you trust a strategy's reported numbers.
Three Levers That Actually Move Your Expectancy
Improving expectancy comes down to three mechanical levers, not a personality overhaul.
- Grow your average win. Let winners run past your first target, scale out in pieces, and use maximum favorable excursion data to see how far trades typically move before reversing.
- Shrink your average loss. Honor your stop every time, and consider automating break-even stop moves so a winning trade can't quietly turn into a loser.
- Trade higher-expectancy setups more often. Tighten entry filters so more of your trades come from your best-performing patterns rather than marginal ones.
- Size positions with Risk of Ruin in mind. A positive expectancy strategy sized too aggressively can still wipe out an account during a losing streak.
Pro Tip: If you scalp frequently, expectancy per trade tends to be small in absolute terms, which makes execution discipline, not signal quality, the deciding factor. A rule-first scalping risk framework is worth reviewing if your setups fall into that category.
Why Expectancy Deserves More Attention Than Win Rate Gets
Traders who journal seriously tend to converge on the same three numbers: expectancy, profit factor, and maximum drawdown. Win rate rarely makes that short list, because it doesn't govern the account balance the way the other three do.
Detailed trade analytics that break down average win, average loss, and R-multiple distribution make this kind of tracking far less tedious than manual spreadsheet work. Features like broker-side protective stops and daily profit and loss lockouts, the kind SafeFly builds into its platform, exist specifically to keep a trader's realized results closer to their planned expectancy rather than letting execution slips erode it. An AI-driven review of trade patterns can also flag when your actual average loss is drifting wider than your plan assumes. Run your expectancy experiments in batches of at least 30 to 100 trades before drawing conclusions, and treat anything smaller as a working hypothesis.
The Real Lesson Traders Miss About Win Rate
Most trading education treats win rate as a proxy for skill, and that's the core mistake. A trader who wins 35% of the time with a well-managed 3:1 reward-to-risk ratio is often in far better shape than one winning 65% of the time with a 1:2 ratio, yet the second trader gets the compliments at the trading desk.
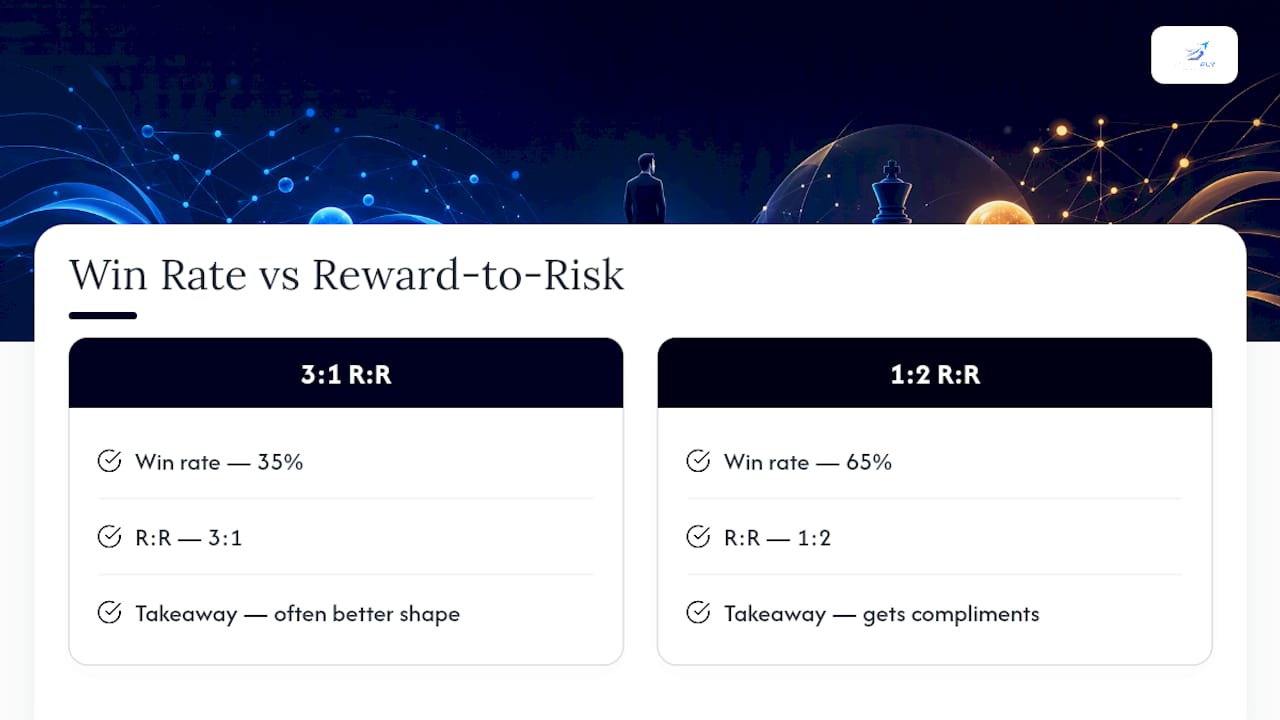
The conventional advice, "just find a strategy that wins more often", actively works against most traders because it pushes them toward tighter stops and smaller targets to inflate the hit rate. That's the opposite of what a strong reward-to-risk profile requires. What the numbers actually support is spending your analytical energy on payoff size first: how large are your winners relative to your losers, and how consistent is that ratio across 100 or more trades?
If you take one thing from this, prioritize the breakeven win rate calculation over your raw win percentage. Knowing you only need to win 33% of the time at a 2:1 ratio changes how you evaluate every trade you take, and it stops you from abandoning a sound strategy just because a string of losses made the win rate look ugly on a given week.
— Arturo
Track Expectancy Across Every Tradovate Account You Run
Calculating expectancy from a single account's trade log is one thing. Keeping that number consistent across five or six Tradovate accounts, each with its own execution timing and human error risk, is a different problem entirely. SafeFly mirrors trades from a lead account to every other connected account automatically, so the reward-to-risk ratio you calculated on paper doesn't quietly erode account by account due to manual copying delays.

Every mirrored trade goes out with a broker-side protective stop attached, and daily profit and loss lockouts stop a strategy's realized expectancy from drifting far below its planned figure during a bad session. Detailed trade analytics and AI coaching help you spot exactly which lever, average win, average loss, or trade frequency, is dragging your numbers off plan. If you manage multiple Tradovate accounts and want your calculated edge to survive contact with live execution, see how SafeFly's mirroring and stop system works and connect your accounts through its secure OAuth integration.
Sources
- Expectancy: The Single Number That Tells You Whether Your Trading System Actually Works - NexusFi Academy
- Why Expectancy Beats Win Rate | Pro Trading Journal
- The Win Rate Myth: Why the Metric Every Trader Obsesses Over Tells You Almost Nothing About a System's Real Performance - Trading Strategies - MQL5
- Win Rate vs Expectancy: What Actually Makes You Money - CurvedTrading
- Trading Expectancy: The Formula That Predicts If Your ... - TradeZella